|
Software systems and computational methods
Reference:
Shcherban', P.S., Sokolov, A.N., Abu-Khamdi, R.V., Esayan, V.N. (2022). Investigation of cavitator failure statistics at fuel oil facilities of thermal power plants by using regression and cluster analysis. Software systems and computational methods, 3, 45–60. https://doi.org/10.7256/2454-0714.2022.3.38841
Investigation of cavitator failure statistics at fuel oil facilities of thermal power plants by using regression and cluster analysis
Shcherban' Pavel Sergeevich
ORCID: 0000-0001-5106-7852
PhD in Technical Science
Associate Professor, Institute of High Technologies, Immanuel Kant Baltic Federal University
236010, Russia, Kaliningrad region, Kaliningrad, Basseynaya str., 38, sq. 27

|
ursa-maior@yandex.ru
|
|
 |
Sokolov Andrei Nikolaevich
PhD in Technical Science
Associate Professor, Institute of High Technologies, Immanuel Kant Baltic Federal University
236010, Russia, - oblast', g. Array-Array, ul. Array-Array, -
|
|
tengritag@gmail.com
|
|
 |
Abu-Khamdi Reda Validovich
Bachelor's degree, Institute of High Technologies, Immanuel Kant Baltic Federal University
-, Russia, - oblast', g. Array-Array, ul. Array-Array, -, kv. -
|
|
rabouhamdi@gmail.com
|
|
 |
|
Esayan Vladimir Nikolaevich
Master's degree, Institute of High Technologies, Immanuel Kant Baltic Federal University
-, Russia, - oblast', g. Array-Array, ul. Array-Array, -, kv. -
|
|
esayan_well@mail.ru
|
|
 |
|
DOI: 10.7256/2454-0714.2022.3.38841
EDN: LTMFZL
Received:
26-09-2022
Published:
08-10-2022
Abstract:
One of the main tasks in the management of technological processes is to reduce emergencies and failures of existing equipment. The statistical data obtained during the operation of machines and mechanisms require appropriate mathematical processing to analyze the dynamics of technological processes and establish relationships between deviations, influencing factors and failures. Regression and cluster analyses are convenient tools for processing these data. The failures of cavitation systems are an essential, and at the same time poorly illuminated topic in scientific periodicals. Cavitators are relatively common technical devices that allow maintaining the technological parameters of fuel oil in tank farms at the required level (viscosity, water content, adhesive properties). The practice of using cavitators on fuel oil farms of thermal power plants in the Kaliningrad region shows that these technical devices can fail relatively often. So, in case of disconnection or restriction of the supply of the required volumes of gas to the thermal power plant, reserves of fuel oil from the fuel park can be used. In turn, the failure of the cavitation system may lead to the impossibility of entering reserve fuel and, as a consequence, to the shutdown of power generation. Thus, the problem of ensuring energy security and the reliability of cavitation systems are closely interrelated. In this study, an array of accumulated statistical information on the parameters of the functioning of cavitators in fuel oil farms and the moments of failure is analyzed. Regression and cluster analyses were used to process the data array, which made it possible to determine the relationship between the types of failures and the influencing factors and to rank the weight of factors according to the degree of their impact on cavitation equipment. Based on the results of mathematical processing and data analysis, proposals have been developed to ensure greater technical reliability of cavitators, reorganize their maintenance system and reduce the number of failures.
Keywords:
regression analysis, cluster analysis, least squares method, k-clustering method, oil and gas equipment, cavitation equipment, analysis of statistical data, equipment failures, equipment reliability, wear and tear
This article is automatically translated.
Introduction. Regression analysis developed in the second half of the XIX-early XX century (F. Galton, K. Pearson, E. Sluchtsky, etc.), as well as cluster analysis developed in the middle of the XX century (G. Shteyngauz, S. Lloyd, J. Hodges, R. Sokal, etc.) have found wide application in assessing the technical condition of machines and mechanisms, determining the causes of failures, the establishment of close relationships between failure rates and influencing factors. These mathematical tools are often used in the analysis of statistical data on technological processes of conveyor production, equipment repairs, analysis of deviations in the accuracy of welding processes, installation, evaluation of the relationship of product quality deviations with influencing factors. Arrays of statistical data obtained in various mechanical, thermobaric, chemical, complex processes are processed with similar tools and serve as the basis for decision-making by engineering personnel.The data set obtained during the operation of fuel oil farms, including data on cavitator failures, allowed using regression and cluster analysis to assess the degree of influence of various factors on the failure rate, as well as to identify a causal relationship between factors affecting cavitators and equipment shutdowns /accidents. It is worth noting that the use of cavitators for processing reserve fuel (fuel oil) allows: -Increase the energy value of fuel oil and maintain their quality indicators. -To reduce the content of substances that reduce the service life of furnaces and boilers, as well as to reduce the toxicity of gorenje products [1]. When the discharged bubbles collapse, a shock wave occurs in the fuel oil, which breaks up chains of molecules, substances and destroys its physico-chemical structure. After such treatment, the number of low-molecular compounds increases and a new structure is formed. As a result, after cavitation treatment and subsequent chemical reactions, the amount of impurities containing free sulfur and phosphorus decreases, which leads to a decrease in the corrosion rate [2]. The use of cavitators is complicated by failures, which is a consequence of a whole complex of factors: production, organizational, quality of materials used, accuracy of equipment diagnostics, frequency and completeness of maintenance and repairs [3]. Based on the results of using regression and cluster analyses, the causes of premature failure of cavitators, factors affecting the frequency of failure of this equipment are established. The statistical data obtained as a result of mathematical processing made it possible to develop organizational, managerial and technical recommendations for operators of cavitation systems in order to reduce the number of emergency situations and ensure the continuity of operation of this equipment. 1. Features of the use of regression and cluster analysis for processing statistical data on equipment failures. Regression analysis is a research method that allows us to obtain a functional empirical dependence of one random variable on another based on statistical processing of an array of experimental data. The main task of regression analysis is to construct a mathematical model (regression curve) describing the relationship between variables: dependent, random and one or more independent random or non-random parameters [4].In the simplest case of regression analysis for two variables, there are n pairs of experimentally found or observed values (Xi; Yi) and it is required to obtain the dependence y = f(x) in an analytical form. First of all, for visual analysis, these pairs of values are displayed on the X-Y diagram. Further, based on visual analysis and/or a priori information, one or another type of function is selected (polynomial, exponential, sinusoidal, etc.), which from the researcher's point of view most plausibly describes the dependence of y(x). After selecting the type of function, it is required to find numerical coefficients at which the selected function best corresponds to the results of observations and evaluate the correctness of the selected mathematical model [5]. Calculation of numerical values of coefficients at which the selected function "best" corresponds to the results of observations can be performed in several ways. The most common and easiest to implement is the least squares method (OLS) [Draper, N.R. and Smith, H. Applied Regression Analysis. 2nd Edition, John Wiley & Sons, New York. 1981. 709pp.] Alternatives are the maximum likelihood method [see, for example, Rossi, Richard J. (2018). Mathematical Statistics: An Introduction to Likelihood Based Inference. New York: John Wiley & Sons. 448pp (p. 227). ISBN: 978-1-118-77104-4], the method of moments [see, for example, O. Kimiko, K. O. Bowman & L. R. Shenton, "Estimator: Method of Moments", pp 2092-2098, Encyclopedia of statistical sciences, Wiley (1998)], as well as a number of others. In this study, the least squares method is used, in which the coefficients of the approximating function y=f(x) are chosen so that the sum of the squared deviations (Yi – f(Xi))2 would be minimal. The use of regression analysis in this case is complicated by the choice of a value that could be interpreted as a Y – variable with which the values of the approximating function would be compared. Usually Y is a continuous quantity. In the case of cavitators, the failure event itself is binary in nature: either there is a failure, or there is none, and only the values of the influencing parameters at which this failure occurred are recorded [6]. In addition, we had information at our disposal about the circumstances of only a little more than two dozen cavitator failures, so it is not necessary to talk about any more or less correct probability of failure, which could act as a continuous variable Y. In connection with the noted features, the following approach was applied. For each of the influencing parameters X, a series with information about the values of the parameters in case of failure was sorted in ascending order X and the number of a member of such an ordered series played the role of a variable Y. That is, yi is the number of failures in which the value of the analyzed parameter is greater than or equal to xi. The use of cluster analysis for processing statistical data on failures in technology is also an effective tool that allows you to stratify data, determine the mutual influence of parameters on each other. This type of analysis has a number of features. Thus, it is possible to apply various approaches of cluster analysis to data processing. The hierarchical approach allows analyzing a variety of objects with a certain degree of connectivity (for example, types of equipment defects, types of repair materials, types of chemical reagents for maintenance) and either separating them (divisive approach) or combining them (agglomerative approach) depending on the problem being solved [7].
The approach based on the Kohonen neural network (Kohonen maps) – allows you to process information on a selection of elements, ordering elements into relatively homogeneous groups. After that, a matrix of indicators is formed. A Kohonen map is constructed based on the matrix. When training the Kohonen map, the vector of the input array is compared with the vectors of the neurons of the active layer. The comparison is made by the proximity function. The neuron of the active layer, for which the value of the proximity function between the vector of the input array and the vector of neurons of the active layer is maximum, is declared the "winner". Thus, it becomes possible to stratify the data. For example, it is possible to process data on failures and wear of pipeline networks, on failures of control and measuring equipment (sensor systems) - to identify elements that require major repairs / replacement, routine repairs that require additional maintenance and do not require work beyond the established current procedures. At the same time, there are also a number of restrictions for the use of Kohonen cards. For example, the final result of the neural network operation in the map depends on the initial settings of the network, i.e. outliers in the initial processed data package can significantly affect the accuracy of the results. The DBSCAN clustering approach (Density-based spatial clustering of applications with noise) – allows you to filter noise and outliers well in the stream of processed data. Since this algorithm is focused on finding "neighbors" for each of the analyzed data element, in the absence of a neighborhood, the element is discarded as "noise". The method is good for processing telemetry data, remote monitoring of the technical condition of the sensor system, processing the results of vibration diagnostic monitoring of operating equipment. The elimination of obvious "noise" elements makes it possible to clear the sample and form clear clusters, which improves the analysis results without loss of data quality [8]. However, there is a specific use here. This approach can be applied to data obtained from technical devices operating in conditions of increased generation of non–standard and random "noise" data - working turbines, ship propellers, engines, otherwise, with stable constant operation of an equipment element (linear parts of pipelines, tanks, reservoirs), there is a risk of taking out single data for "noise", while they are the ones in these devices that can signal an accident or failure. An approach based on the k-means method (one of the most common types of cluster analysis). The idea of the method is that, having a package of statistical data and initially assuming the number of clusters in the processed array, it is possible to consistently iterate to calculate the center of mass for each of the clusters. At the same time, the vectors for each of the data elements are divided into clusters again in accordance with which of the new centers turned out to be closer according to the chosen metric. The algorithm terminates when there is no change in the center of mass of the clusters at some iteration. As a result, it is possible to determine the frequency and probability of the realization of an event, its weight and relationship with other factors (depending on the characteristics of the formed clusters, the position of the center of mass, the density of the distribution of events). This method is convenient for analyzing failures and malfunctions of equipment operating under standard conditions, without sudden loads and changes in the picture of acting external forces. At the same time, it is not necessary to reduce the amount of noise and stuffing, in addition, quite certain relationships are established between the causes of failures and accidents and the acting factors or a group of factors [9]. For the considered problem of failures and shutdowns of cavitators in the fuel oil industry, this method is applicable. Next, we will consistently present the problems of cavitation equipment operation, data on failures, and also apply regression and cluster analysis to process the available statistical information. 2. Cavitation installation failures and analysis of their causes. Formation of a statistical database. Cavitation installations used in tank farms have a mechanical part consisting of a cavitating organ that creates an artificial discharge of the liquid flow, as well as an electrical part responsible for monitoring and controlling the process. During 2018-2021, statistical data on cavitation equipment failures were collected at a number of thermal power plants in the Kaliningrad region. As a result, it was found that the most frequent phenomena leading to the system shutdown in the mechanical part are fuel oil leaks in the flange nipple connections, and in the electrical part - the triggering of emergency protection for one of the electrical consumers (Fig. 1.). Guided by the Pareto principle, it was decided to proceed directly to the study of the causes of the two most frequent types of cavitator failure. To understand the causes of leaks in the flanged nipple connectors of cavitators, as well as the causes of emergency protection for energy consumers, diagrams of the main factors were formed, the implementation of which could lead to such failures (Fig. 2., Fig. 3.). 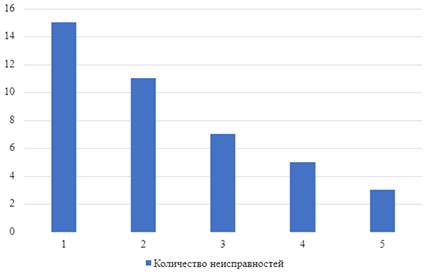
Fig. 1. The number of failures (by type) recorded during the operation of cavitation installations in 2018-2021. 1-liquid leaks in the flanged nipple connectors; 2-emergency protection is triggered by one of the electrical consumers; 3-no readings, incorrect readings of pressure gauges; 4-no flow meter readings; 5-the fan in the control room does not work Based on the records of maintenance and repair logs of cavitation installations, acts of technical expertise of equipment operability, recorded indicators of monitoring systems, a pool of statistical data was formed based on these factors. Namely, for each fact of leakage, the depth of metal corrosion corresponding to this event, the density of the gasket and the tightening torque were recorded. For each fact of operation of the protection system, the corresponding temperature of the transformer elements, the current strength and the excess voltage of the transformer were recorded.
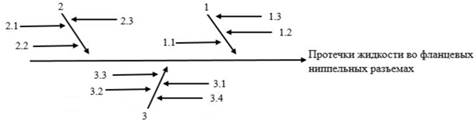
Fig. 2. Group of factors affecting the occurrence of leakage in flange niepalnych connectors cavitators (failure on mechanical properties - leakage) 1. Easing tightening of fasteners; 1.1. Failure to comply with staff technology installation; 1.2 the Backlash exceeds the allowable value; 1.3 the thread Wear of the connecting holes; 2 Defects strip; 2.1 Crushing strip; 2.2 Nicks strip; 2.3 Low quality parts; 3 leak caused by the destruction of parts; 3.1 Chemical degradation of the composite flange connections; 3.2 Mechanical damage; 3.3 Deformation under the influence of vibration and bending loads; 3.4 Corrosion failure of metal components gasket or flange 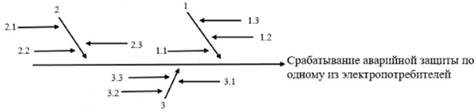
Fig. 3. Group of factors that affect the emergency protection for consumers cavitators (denial of electric indicators – emergency release) 1. a tripped circuit breaker; 1.1. the presence of a short circuit; 1.2 the faulty circuit breaker; 1.3 the failure of the remote control system; 2.operation of the electrothermal relay; 2.1 relay problem; 2.2 overload of the motor; 2.3 problem with the sensor shaft seal for pump (no feedback in the system); 3.the pressure drop at the outlet of the pump below the permissible (the sensor responds to pressure drop); 3.1 malfunction of the gauge;3.2 fault circuit interrupt protection; 3.3 sensor failure operation of the pump Later in the study, the task was to process the data mathematically and understand the relationships between the two main types of fixed bounce cavitators with one hand and release of these factors are beyond the permissible values (as defined in the technical regulations), on the other hand. A pool of data were stratified first by type of failure cavitator, then within each species on impact factors. As the dependent variable (i.e. "y") was chosen as the frequency of failures cavitators. More precisely, the recorded number of accidents in the case that the value of a particular independent variable exceeds the maximum allowable value in accordance with the documentation for the equipment. This was specified fixed value of the factor at the time of detection of the failure and the range of valid values. For further processing, it was decided to use regression and cluster analyses. This approach allowed us to determine the tightness of the mutual influence of deflection factors from the permissible values for the failure of the cavitation equipment. In the result, it is possible to identify the weight of the factors that led to the emergence of the refusal of the cavitators and as a consequence to develop recommendations to minimize their impact. 3. Using regression analysis to determine the relationship between failure cavitators and influence factors. As already mentioned, the main task of regression analysis is to establish the functional dependence of one quantity from another. In our case, to establish the functional dependence of the quantity (frequency) waiver of numerical values from a certain impact parameter [10]. To conduct a regression analysis using data receive in the course of fixing the leaks at the flange-threaded connectors cavitators and emergency protection on power cavitators. Comparable data on the incidence of leaks and density gaskets used, the depth of corrosion of the metal and the degree of tightening of fasteners flange-pin connectors. For failures related to emergency protection consumption, comparable data on the failure rate, the temperature at which the failure occurred, the force of the current exceeding the allowable stress. Rangiroa the number of failures for each of the analyzed mechanical parameters obtained linear dependence of the frequency of leaks in the cavitators from each of the influencing factors, shown in Fig. 4. To assess the correctness of the model (determine how good the approximation function corresponds to the experimental data) is most often used the following statistical parameters: the offset (BIAS), root mean square error (RMSE), correlation coefficient (R) and coefficient of determination (square of the correlation coefficient, R2) [11]. 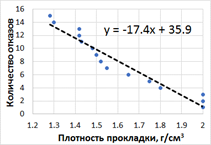 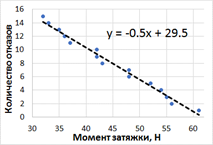 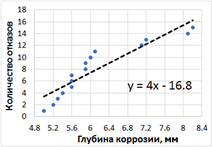
(a) (b) (c) Figure 4. Observed values of leakage frequency in cavitators depending on the gasket density (a), tightening torque (b) and the depth of metal corrosion (c). Ranking the number of failures for each of the analyzed parameters, depending on the energy consumed, we obtain the dependences of the frequency of emergency protection from each of the influencing factors, shown in Fig. 5. 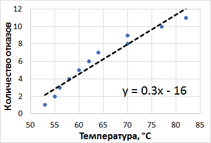 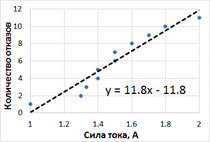 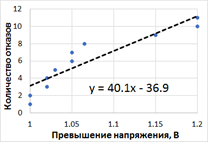
(a) (b) (c) Figure 5. The observed values of the frequency of operation of the emergency protection depending on the temperature of the transformer elements (a), the current values of the transformer (b) and the excess voltage of the system (c). - BIAS refers to the difference between the calculated and measured values over the entire observation period:  . .
A positive BIAS value means that the model gives overestimated values on average, and a negative one – underestimated. I.e. BIAS serves as an indicator of systematic error. - the RMS error (RMSE) is the square root of the sum of the squares of the differences between the results of observations and calculations divided by the total number of observations:.  In fact, it is an assessment of the effectiveness of the least squares method[12]. In fact, it is an assessment of the effectiveness of the least squares method[12].
In the future, if there is a significantly larger volume of actual data on equipment failures, more complex models could be used instead of simple linear models. For example, consider a piecewise linear model for the dependence of the number of failures on the density of the gasket. We will assume that if the density of the gasket lies within the normal range (1.5–2 g/cm3), the approximation is made by one linear function, and if outside these limits, then by another. | 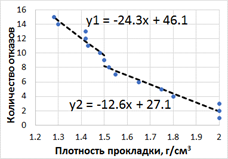
Fig. 6. Piecewise linear model of the dependence of the number of failures on the density of the gasket |
Table 1. Statistical parameters for evaluating the correctness of linear and piecewise linear models. | Linear | Piecewise linear | | BIAS | RMSE | R2 | BIAS | RMSE | R2 | | 0 | 1,13 | 0,93 | 0 | 0,58 |
0,95 | | Then the least squares method allows us to construct a piecewise linear model, presented in Fig. 6 [13,14]. It follows from Table 1 that the accuracy of such a model in terms of RMSE parameters and the coefficient of determination is significantly higher than the simple linear model shown in Figure 4a. Thus, with the gradual accumulation of statistical data on the type and number of cavitator failures at thermal power plants, it is possible to recalculate and switch to more accurate piecewise linear regression models [15]. At the same time, from a technical point of view, the results of the current regression modeling with the construction of linear dependencies show that in the mechanical part the clearest relationship between the number of failures and deviations from the permissible values of the parameters can be traced in the tightening moment of the gasket. If the gasket is under–stretched, there is a free space through which leakage occurs or access of water and air is possible to form corrosion zones. If the gasket is overstretched, then it becomes more tense and brittle – it wears out and cracks faster, resulting in even greater leaks and damage. Thus, in the mechanical part, this factor plays the greatest role in the development of failure. In the electrical part, the current strength and temperature of the electrical elements of the cavitation equipment are of greater importance. These parameters are interrelated, and at the same time, the increase in the number of failures for these two parameters is more intense than with an increase in resistance. This is due to the specifics of the materials used, for resistor systems and sensors in cavitators. The findings suggest the need for manufacturers to revise the characteristics of the systems and make them more resistant to current fluctuations and temperature changes. 4. Application of cluster analysis to determine the relationship between cavitator failures and influencing factors. The applied regression analysis allowed us to consider the individual effect of the deviation of one of the operating parameters on the frequency of cavitator failures. However, of course, a complex of factors affects the equipment, and to study the synergetic effect of such deviations, we use cluster analysis. Cluster analysis allows you to identify the structure of statistical data and establish the presence of atypical objects or specific clusters. The definition of clustering centers will allow you to determine the amount of data spread for each of the clusters, that is, to establish the average deviation, and, consequently, to determine which values of the operating parameters of cavitation equipment will be most characteristic of the operational, limit and inoperable states. When performing this study, it is possible to use various clustering methods, for example, Kohonen neural networks, a hierarchical method, but the most convenient and visually indicative method will be the k-means method developed by the Polish scientist Hugo Shteyngauz. Cluster analysis by the k-means method assumes the initial determination of the number of clusters. Taking into account statistical data on each of the factors affecting cavitators, three clusters can be distinguished for failures in the form of leaks – a cluster of data on parameters in the "permissible zone", a data cluster in the "limit state zone", a data cluster in which the equipment is in the "failure zone" state. In the case of the electrical part, only two clusters are allocated – the "permissible zone" and the "failure zone". After allocating the number of clusters inside them, clustering centers are randomly selected. Then the arithmetic averages of the points belonging to a certain cluster are calculated. It is these values that become the new cluster centers. After a number of iterations, the clustering center point of each cluster is stabilized, taking the optimal value. Since the beginning of the algorithm relies on a random selection of the initial clustering centers, in order to ensure the most qualitative data partitioning into clusters, the algorithm is repeated several times, while the result with the highest quality solution of the clustering problem is selected. According to Kleinberg's impossibility theorem, there is no optimal clustering algorithm, but the quality of the algorithm result can be assessed by a number of criteria. To assess the clustering quality of the obtained data, the criteria of compactness and separability of clusters, the Dunn index and silhouette were selected [16]. The compactness of clusters (Cluster Cohesion) measures the degree of similarity of cluster elements. In this case, we will consider the degree of similarity to be the sum of the squares of the Euclidean distance between points inside one cluster and the center of this cluster. The lower this value, the better the clustering quality, since conditionally similar points fall into one cluster. Compactness is expressed by the following formula: 
In the above formula  – a cluster from the set of clusters obtained by the algorithm – a cluster from the set of clusters obtained by the algorithm   , – a cluster element , , – a cluster element ,  – the center of the cluster . – the center of the cluster . The separability of clusters evaluates how much the resulting clusters are separated from each other. The greater the cluster separation value, the better similar elements were grouped. In data analysis, we will use the separability of each cluster individually, and the average separability of clusters as a whole [17]. Individual separability of a cluster can be defined as the minimum distance from the center of this cluster to the centers of other clusters:, are cluster centers and respectively. 
  
The average separability can be calculated as the average distance of the centers of each cluster to the center of the entire sample: - the number of clusters, – the center (midpoint) of the sample, – the center of the cluster. 
 
The Dunn index makes it possible to estimate the intracluster compactness and separability of clusters (the distance of clusters from each other). The higher the Dann index, the better the clustering. The formula for calculating the Dann index is as follows:In this case – the set of clusters, – the distance function. 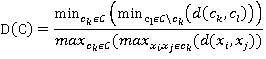
and  – clusters from the set – clusters from the set  , ,  – cluster elements . The distance function – cluster elements . The distance function  in the case of the distance between clusters is defined as the minimum distance between the cluster elements: in the case of the distance between clusters is defined as the minimum distance between the cluster elements: 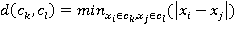 . .
In the case of the distance between the elements , the Euclidean distance is calculated. Evaluation of the cluster silhouette also qualitatively evaluates how much a point fits to its cluster. The silhouette of a point is determined by the degree of its similarity with the points in the cluster, and the degree of its difference with the points of other clusters. For a point , the Euclidean distance is calculated. Evaluation of the cluster silhouette also qualitatively evaluates how much a point fits to its cluster. The silhouette of a point is determined by the degree of its similarity with the points in the cluster, and the degree of its difference with the points of other clusters. For a point , the silhouette is expressed by the formula: , the silhouette is expressed by the formula: 
The functions and and are the average distance from a point are the average distance from a point to other points in the cluster and the minimum average distance from a point to points in other clusters, respectively.The cluster module and in this case means the number of elements in this cluster [18]. to other points in the cluster and the minimum average distance from a point to points in other clusters, respectively.The cluster module and in this case means the number of elements in this cluster [18]. 
 
The estimate of the cluster silhouette can be defined as the average value of the silhouette of its elements.To calculate the presented results, a python script was developed using numpy libraries for efficient work with multidimensional data, and matplotlib for data visualization. 
The script consists of the implementation of the k-means algorithm, functions for calculating the above-described quality ratings, as well as for visualizing the results obtained. To create a shell for each cluster, an ellipsoid was constructed with a center at the central point of the cluster, and axes equal to the diameter of the cluster (the difference between the maximum and minimum values) at the corresponding coordinate [19]. Performing the clustering algorithm, and calculating the above characteristics for the resulting clusters, we obtain the following tables (Tables 2 and 3). Analyzing the clustering results, it can be noted that the Dann index has a rather low value, which is associated with a high compactness value – that is, the spread in each particular cluster, and a low separability value, both for each particular cluster and for many clusters as a whole, however, the silhouette of each cluster exceeds the average value , which indicates sufficient similarity data grouped into clusters , which indicates sufficient similarity data grouped into clusters From this we can conclude that despite the spread of points in clusters, each cluster contains quite similar points. As a result of the cluster analysis, it was found that deviations in all considered parameters, both in the mechanical and electrical parts, participate in the transition of cavitation equipment from a working state to a limiting and inoperable state. This is indicated by the separability of clusters. Table 2. Clustering indicators in the analysis of failures of the mechanical part of cavitators. | Cluster/Characteristic | Permissible zone (green) | Failure zone (red) | Limit state zone (orange) |
| The central point | (55.6, 1.7, 5.6) | (34.6, 1.37, 7.34) | (44.6, 1.75, 5.5) | | Compactness | 46.35 | 20.14 | 39.4 | | Separability of the cluster | 3.68 | 3.38 | 3.38 | | A shadow | 0.6 |
0.71 | 0.52 | | The Dunn Index | 0.45 | | Separability of clustering | 7.28 | Table 3. Clustering indicators in the analysis of failures of the electrical part of cavitators. | Cluster/Characteristic | Permissible zone (green) | Failure zone (red) | | The central point | (58.29, 1.42, 1.01) | (74.75, 1.63, 1.14) | | Compactness |
93.5 | 103.33 | | Separability of the cluster | 8.22 | 8.22 | | A shadow | 0.67 | 0.52 | | The Dunn Index | 0.5 | | Separability of clustering | 8.22 | The larger size of clusters in an inoperable and marginal state, compared with the cluster of the permissible zone, indicates that, firstly, stochastic processes play a large role in these clusters (which is typical for equipment that fails), and secondly, indirectly indicates that the failure rate of cavitation equipment is affected and other factors not considered in this study (which makes the clusters of the limit state and the state of "failure" of the system less homogeneous).
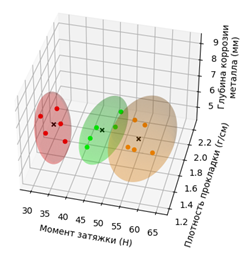 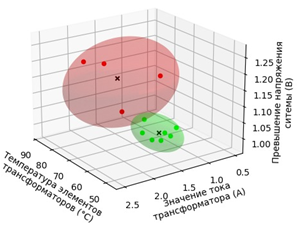
Figure 7. The results of the cluster analysis on the failure of mechanical (a) electric and (b), systems cavitators. Red – clusters in which the equipment is out of order (failure), orange – clusters in which the equipment is in the ultimate state, green - clusters, in which work equipment is in a valid In most clusters, the distance of the points from the centers clustering uniform that shows in the links between all the considered parameters and the variance between them [20]. Slightly larger and more blurred is the cluster "opt-out" in the electrical part, which is obviously associated with insufficient number of measurements or with large values of the deviations of the considered parameters of the limit values. The obtained results of the cluster analysis allow us to develop the technological and organizational measures to ensure greater stability of the cavitators in the reservoirs of thermal power plants. This can be achieved through the reorganization of the system of maintenance of these mechanisms, and through working with suppliers of equipment and consumables. Conclusion. The result of the study revealed that the greatest number of leaks in cavitators is due to the low quality of the used gaskets and uneven by tightening threaded connections. The failure of electric parts in General due to the temperature rise of current-carrying elements of the system and increasing the current, which leads to an emergency stop cavitator. Used regression and cluster analyses allowed to determine the influence of the considered factors on the transition of the system from a healthy state to the limit and further problems. In regression analysis, this transition can be associated with the point of change of the function (if the piecewise-linear model), and cluster analysis with a blank space between the clusters harakterizuetsya the separability of one from another. In the end, using both mathematical methods established that the greatest influence on the performance of the cavitators has a deviation from the admissible values of torque strips and density in mechanical parts, as well as current and temperature into electric parts. These parameters are most closely related. We used the method of least squares, as well as K-clustering method has shown its effectiveness for the treatment of a small array of statistical data (which, unfortunately, is the specific use of the equipment). In General, further research bounce cavitators with the accumulation of additional information rationally using non-linear regression models, and piecewise-linear models. You also need to consider the possibility of carrying out measurements and other parameters to Refine their interaction and improve the accuracy of clustering. Based on the obtained mathematical results can be generated a number of technical solutions to identified problems. So reducing the number of failures cavitators can be achieved by replacing the used pads on pads with more durable, as well as when using a torque wrench during Assembly of the elements of the cavitators. In addition, the required changes to the schedule of maintenance and repair of equipment. It is necessary to consider the possibility of implementing a remote monitoring systems installation options. Also rational and replace the materials used in electrical systems or changes in the electrical circuit to ensure it less sensitive to changes in current or temperature rise (working with the manufacturer of electric parts). For example, this can be achieved by introducing into the design of the electric circuit of current sensor based on Hall effect. Thanks. Regression analysis of the data was carried out in the framework of the state assignment of the IO RAS (theme FMWE-2021-0012).
References
1. Mutugullina, I. A. Primenenie podogrevatelej pri ispol'zovanii mazuta [Application of heaters in fuel oil usage] / I. A. Mutugullina // Mezhdunarodnyj nauchnyj zhurnal. – 2017 – № 03-2. – S. 92-95.
2. Saltanaeva, E. A. Opredelenie effektivnosti primeneniya kavitatorov pri podgotovke k szhiganiyu mazuta s vysokim soderzhaniem vody [Determination of the effectiveness of cavitators usage in preparation for the combustion of fuel oil with a high water content] / E. A. Saltanaeva // Tinchurinskie chteniya : Materialy XIV Mezhdunarodnoj molodezhnoj nauchnoj konferencii. V 3-h tomah, Kazan', 23 aprelya – 26 2019 goda / Pod obshchej redakciej E.YU. Abdullazyanova. – Kazan': Kazanskij gosudarstvennyj energeticheskij universitet, 2019. – S. 249-251. – EDN SEXETF.
3. Esayan, V. N. Specifika ispol'zovaniya kavitatorov dlya bor'by s zastyvaniem rezervnogo topliva (mazuta) v stal'nyh rezervuarah [The specifics of cavitators usage for combat the solidification of reserve fuel (fuel oil) in steel tanks] / V. N. Esayan // Molodezh' i XXI vek-2022 : Materialy 12-j Mezhdunarodnoj molodezhnoj nauchnoj konferencii. V 4-h tomah, Kursk, 17–18 fevralya 2022 goda / Otv. redaktor M.S. Razumov. – Kursk: YUgo-Zapadnyj gosudarstvennyj universitet, 2022. – S. 228-232. – DOI 10.47581/2022/ML-61/Esaan.01. – EDN SUZDTE.
4. Application of Correlation-Based Regression Analysis for Improvement of Power Distribution Network / Sh. Hagiwara, T. Uezono, T. Sato, K. Masu // IEICE Transactions on Fundamentals of Electronics, Communications and Computer Sciences. – 2008. – Vol. E91-A. – No 4. – P. 951. – EDN IPQZCN.
5. Smirnova, A. Correlation-regression analysis in Excel when solving problems / A. Smirnova // Process Management and Scientific Developments. Part 1., Birmingham, 09 июня 2021 года. – Мельбурн: AUS PUBLISHERS, 2021. – P. 40-44. – DOI 10.34660/INF.2021.51.55.007. – EDN ZDNYRN.
6. Mohan, R., Sivakumar, V. Analysis and correlation of ultrasound cavitation energy in ultrasound tank with coloration of fibrous materials: leather dyeing. Braz. J. Chem. Eng. (2022). https://doi.org/10.1007/s43153-022-00241-7
7. Santosh Kumar Majhi, Shubhra Biswal, Optimal cluster analysis using hybrid K-Means and Ant Lion Optimizer, Karbala International Journal of Modern Science, Volume 4, Issue 4, 2018, Pages 347-360, ISSN 2405-609X, https://doi.org/10.1016/j.kijoms.2018.09.001.
8. Lopes H. E. G., Gosling M. S. Cluster analysis in practice: Dealing with outliers in managerial research //Revista de Administração Contemporânea. – 2020. – Т. 25.
9. A Performance of the Scattered Averaging Technique based on the Dataset for the Cluster Center Initialization / A. B. W. Putra, A. F. O. Gaffar, B. Suprapty, Mulyanto // International Journal of Modern Education and Computer Science. – 2021. – Vol. 13. – No 2. – P. 40-50. – DOI 10.5815/ijmecs.2021.02.05.
10. Gruzdev A. N. Accounting for long-term serial correlation in a linear regression problem //IOP Conference Series: Earth and Environmental Science. – IOP Publishing, 2019. – Т. 231. – №. 1. – С. 012020.
11. Frumin, L. L. Linear least squares method in nonlinear parametric inverse problems / L. L. Frumin // Journal of Inverse and Ill-Posed Problems. – 2020. – Vol. 28. – No 2. – P. 307-312. – DOI 10.1515/jiip-2019-0009
12. Akimova, I. V. Komp'yuternaya realizaciya metoda naimen'shih kvadratov v zadachah stroitel'nogo materialovedeniya [Computer implementation of the least squares method in problems of building materials science] / I. V. Akimova, E. I. Titova // Sovremennye problemy nauki i obrazovaniya. – 2020. – № 2. – S. 18. – DOI 10.17513/spno.29626.
13. Sapkina, N. V. Nechetkie linejnye regressionnye modeli. Metod naimen'shih kvadratov dlya modeli s chetkimi vhodami i gaussovym nechetkim vyhodom [Fuzzy linear regression models. Least Squares for a Model with Crisp Inputs and a Gaussian Fuzzy Output]/ N. V. Sapkina // Global'naya nauchnaya integraciya. – 2011. – № 6. – S. 66-67.
14. Noskov, S. I. Ocenka dinamiki vkladov faktorov v linejnoj regressionnoj modeli [Estimation of the dynamics of the contributions of factors in a linear regression model]/ S. I. Noskov // Vestnik Voronezhskogo gosudarstvennogo tekhnicheskogo universiteta. – 2021. – T. 17. – № 5. – S. 15-19. – DOI 10.36622/VSTU.2021.15.5.002.
15. A Multiprocess Joint Modeling Method for Performance Prediction of Nonlinear Industrial Processes Based on Multitask Least Squares Support Vector Machine / F. Chu, X. Ma, B. Dai [et al.] // Industrial and Engineering Chemistry Research. – 2022. – Vol. 61. – No 3. – P. 1443-1452. – DOI 10.1021/acs.iecr.1c04075.
16. Pandey, P., & Singh, I. (2016). Comparision between K-mean clustering and improved K-mean clustering. International Journal of Computer Applications, 146(13), 39-42. http://doi.org/10.5120/IJCA2016910868
17. Lund B., Ma J. A review of cluster analysis techniques and their uses in library and information science research: k-means and k-medoids clustering //Performance Measurement and Metrics. – 2021.
18. Borisova, L. V. Osnovy teorii eksperimenta. Postroenie matematicheskih modelej [Fundamentals of the theory of experiment. Building mathematical models]/ L. V. Borisova, V. P. Dimitrov, E. M. Zubrilina. – Rostov-na-Donu : DGTU-Print, 2018. – 105 s. – ISBN 978-5-6041793-7-6
19. Kravcov, A. N. Modelirovanie tekhnologicheskogo obespecheniya proizvodstvenno-tekhnicheskih harakteristik blochno-modul'nyh instrumentov s elementami diagnostiki i kontrolya na osnove sistemnoj optimizacii [Modeling of technological support of production and technical characteristics of block-modular tools with elements of diagnostics and control based on system optimization] : Monografiya / A. N. Kravcov. – Ir-bit : Zakrytoe akcionernoe obshchestvo "ONIKS", 2015. – 300 s. – ISBN 978-5-906703-09-5.
20. Shcherbatov, I. A. Upravlenie slozhnymi slaboformalizuemymi mnogokomponentnymi sistemami [Management of complex weakly formalized multicomponent systems] / I. A. Shcherbatov. – Rostov-na-Donu : Yuzhnyj nauchnyj centr RAN, 2015. – 268 s. – ISBN 978-5-4358-0107-1.
|


