|
Finance and Management
Reference:
Kustov N., Gorodilov M.A.
Assessment of the impact of socio-economic indicators of the Volga Federal District of the Russian Federation on the number of payers of the Professional income tax
// Finance and Management.
2024. ą 1.
P. 39-58.
DOI: 10.25136/2409-7802.2024.1.69891 EDN: ZUSAWD URL: https://en.nbpublish.com/library_read_article.php?id=69891
Assessment of the impact of socio-economic indicators of the Volga Federal District of the Russian Federation on the number of payers of the Professional income tax
Kustov Nikita
Postgraduate student; Department of Accounting, Audit and Economic Analysis; Perm State National Research University
14 Kuibyshev str., Perm, 614000, Russia

|
parolaks@yandex.ru
|
|
 |
|
Gorodilov Mikhail Anatol'evich
Doctor of Economics
Associate Professor; Department of Accounting, Audit and Economic Analysis; Perm State National Research University
614000, Russia, Kuibyshev 14 region, Perm, Kuibyshev str., 14
|
|
gorodilov59@yandex.ru
|
|
|
|
DOI: 10.25136/2409-7802.2024.1.69891
EDN: ZUSAWD
Received:
18-02-2024
Published:
11-03-2024
Abstract:
This article examines the impact of socio-economic indicators of the Volga Federal District (hereinafter – VFD) on the number of payers of the special tax - «Professional income tax (hereinafter – PIT)». The relevance of the article is due to the need to assess various socio-economic effects that cause an increase in the number of PIT payers in the regions of the Russian Federation. The purpose of this article is to identify these socio-economic indicators and then assess their impact on increasing the number of PIT payers in the region, which allows us to develop measures aimed at tax management in a particular region. Using econometric modeling methods, the authors assessed the impact on the number of PIT payers of such socio-economic indicators of the regions of the Volga Federal District as the number of individual entrepreneurs (hereinafter referred to as sole proprietors), GRP, the execution of regional budgets on PIT revenues, unemployment and nominal accrued wages. The materials used in the research process were obtained from open sources of official state statistics, consolidated tax and budget reports. The main results of this study are: - the indicator of the number of sole proprietors has a positive relationship with the number of PIT payers, which allows us to conclude that in regions with a larger number of individual entrepreneurs, the number of NPD payers is also growing; - the indicator of the number of unemployed has an inverse relationship with the number of PIT payers in the regions of the Russian Federation; Based on the results of an econometric study, the author concludes that a number of socio-economic indicators of the regions of the Volga Federal District have a significant impact on the number of PIT payers.
Keywords:
professional income tax, special tax regime, self-employed, tax experiment, tax management, optimal tax burden, choice of tax regime, econometric modeling, tax policy, tax efficiency
This article is automatically translated.
introduction The special tax regime "Tax on professional income" (hereinafter referred to as the NPD) is established by the Federal Law "On conducting an experiment to establish a special tax regime "Tax on professional Income" dated November 27, 2018 No. 422—FZ[1], and today has become familiar to most citizens of the Russian Federation who have decided to become self-employed. Introduced in 2019, the special tax regime, which was used until recently only as a tax experiment, set its main goal to provide self-employed citizens with favorable conditions for carrying out their activities by offering these persons an optimal tax burden. This goal was outlined in the explanatory note to the draft law "On conducting an experiment to establish a special tax regime "Tax on professional income" in the federal city of Moscow, in the Moscow and Kaluga regions, as well as in the Republic of Tatarstan (Tatarstan)"[2]. The steady positive dynamics of the number of self-employed and tax revenues from the budget shows that this goal has been successfully implemented. The number of NAP payers in the subjects of the Volga Federal District according to the register of small and medium-sized businesses as of September 30, 2023 was 1,404,956 people[3], and the total population of this federal district as of January 01, 2023 was 28,683,247 people.[4], therefore, approximately every 20th citizen of the Russian Federation living in the Volga Federal District had the status of a NAP payer. And this ratio is constantly growing. The question of whether the socio-economic indicators of the subjects of the Volga Federal District have an impact on the number of NAP payers becomes relevant. The practical purpose of this study is to identify and evaluate the indicators that determine the growth of income from the specified tax. THEORETICAL FOUNDATIONS OF THE STUDY The global trend in the development of self-employment is becoming the foundation for various studies and assessments of the impact of various methods of taxation of self-employment on the economy of various regions and countries. For example, in the work of Getz S., Fleming D. and Rupasinga A., the positive impact of the development of self-employment on the growth of per capita income and poverty reduction is studied [1], and in the work of Juan Herreno and Sergio Ocampo, on the contrary, the negative impact of self-employment on the development of lending is assessed, due to the high risks of reducing the income of self-employed persons [2]. There are also many studies on the topic of taxation of the self-employed, among which one can note Ogembo D., who studied the specifics of taxation of self-employed specialists in Africa [3], Luo B., Chong T., touching on the study of the specifics of regional taxation of the self-employed in China [4], Batrancha L.M., Nikita A., De Agostini R. et al., who conducted assessment of compliance with tax legislation by self-employed persons in eleven countries [5], and Ken E., who devoted his work to the study of changes in tax rates on the overall activity of self-employment development [6]. Also, in foreign practice, much attention is focused on studies of the consequences of the development of dependent self-employment, this area was studied by Bozzon R. And Murgia A., who came to the conclusion that the development of dependent self-employment leads to a transformation of the labor market [7], Williams, K.S., Gorodnich, A.V., who concluded that more than 4% of the labor force in Europe are dependent self-employed [8], as well as Slavina Spasova, Denis Bouget, Dalila Gailani, and Bart Vanherke, who studied the social security of dependent self-employed people in European countries [9]. The evolution of self-employment in the Russian Federation from its inception to the introduction and expansion of the NAP to all subjects of the Russian Federation is described in the author's previous work [10]. Within the framework of the current study, the assessment of the impact of the development of the NPD, expressed in an increase in the number of payers of this tax regime, depending on the dynamics of regional socio-economic indicators, should be considered as a tax policy tool that affects the economy of a region, district or the whole country. In domestic practice, the analysis of the mutual influence of the tax policy of the Russian Federation and the economy of the regions is a promising area for research, the mechanisms of tax policy can have a significant impact on the socio-economic development of the subjects of the Russian Federation, and vice versa. Thus, in the work of N.S. Trusova, a methodological toolkit of tax policy aimed at stimulating the economic development of regions was proposed [11]. Current trends in tax policy in the Russian Federation with respect to individuals are aimed at reducing the shadow economy sector, developing small businesses and digitalizing the tax industry, which is confirmed by the active introduction of special tax regimes [12]. The assessment of special tax regimes and the consequences of their implementation on the territory of the Russian Federation has always been an urgent topic and the basis for various studies. The results of these studies are used to adjust tax policy and are taken into account when introducing new tax regimes. Among the authors involved in the study of special tax regimes, one can note A.A. Bochkova and A.V. Yushko, who conducted a legal assessment of special tax regimes [13], A.G. Kazmina and I.V. Lolenko, who assessed the fiscal function of tax regimes and concluded that special tax regimes do not have high fiscal significance, but their The main goal is to stimulate the development of entrepreneurial activity [14], Khizhak N.P., who was engaged in forecasting budget tax revenues from special tax regimes [15].
The topic of NAP and self–employment is also a popular area for research, a number of the following studies can be noted on this issue: Pavlova E.V. – she assessed the impact of NAP on the development of small businesses in the Tver region [16]; Chekmarev O.P. - he investigated the place of the NAP payer in the labor market [17]; Zhukova T.V. – She analyzed the international experience of pension provision for the self-employed with a view to possible application in the Russian Federation [18]. The authors of this article also conducted a number of scientific studies on this topic: a study of approaches and methods for assessing the budgetary effectiveness of the introduction of NAPS in the subjects of the Russian Federation [19], highlighting the features of taxation of the self-employed in the near and far abroad [20], an analysis of the positive effects and risks of the introduction of NAPS in the subjects of the Russian Federation [21], etc. In the context of the study of the impact of the NAP on regional socio-economic indicators, one of the authors conducted a study, and in the article[29] hypotheses were put forward reflecting the relationship of changes in a number of regional socio-economic indicators depending on the dynamics of the number of NAP payers. Other authors who have previously studied this area include Abramova E.A., in whose work a theorized analysis of the positive impact of the NAP on reducing unemployment during the crisis period was carried out [22], and Zvereva T.V., who studied the role of digitalization in the taxation of NAP payers [23]. Doroshenko S.V. also studied the emerging effects of the NAP, assessing with the help of econometric methods the impact of the introduction of the NAP on the share of income from entrepreneurial activity in the income structure of the population in the subjects of the Russian Federation [24]. However, a quantitative assessment of the mutual influence of socio-economic indicators and the number of NAP payers in a particular region of the Russian Federation is being carried out for the first time. The hypothesis of the study: the change in socio-economic indicators of the subjects of the Volga Federal District has an impact on the change in the number of NAP payers. THE RESULTS OF THE STUDY To assess the impact of regional socio-economic indicators on the change in the number of NAP payers in the subjects of the Volga Federal District, we will determine the dependent and explanatory variables. We have taken the indicator of the number of NAP payers as a dependent variable. Explanatory variables consist of regional socio-economic indicators, which are presumably influenced by changes in the number of NAP payers. This choice is due to the selection of explicit indicators from groups for assessing tax efficiency (budgetary, social and economic). Regional socio-economic indicators of the budget efficiency group include: professional income tax – budget execution by income (billion rubles), the number of individual entrepreneurs – small and medium-sized businesses (people); the second group of social indicators includes: gross regional product by subjects of the Volga Federal District (in current prices; million rubles), the number of unemployed aged 15 years and older (people); the third group of economic indicators includes: the average monthly nominal accrued wages of employees for a full range of organizations in the economy as a whole by subjects of the Volga Federal District (R.). The choice of regional socio-economic indicators that influence the change in the number of NAP payers is due to the choice of the most obvious indicators from the groups for assessing the effectiveness of the introduction of tax benefits (budgetary, social and economic). Previously, the author conducted a study on the assessment of the special tax regime "Professional income tax" as a preferential tax regime [25]. To assess the impact of socio-economic indicators of the subjects of the Volga Federal District on the number of NAP payers, we use a sample of panel data consisting of observed statistical data for the period of the special tax regime "Tax on professional income" from 2020 to 2022. The main advantages of using panel data are: a large number of observations, the ability to track dynamics for many objects and the ability to eliminate endogeneity [26]. The collected data contain the regional socio-economic indicators of the subjects of the Volga Federal District necessary for the study. In Table 1, we present a description of the variables, these data, and their indicators, as well as the sources of information. Table 1 Initial data | Full name | The name of the indicator | Ed. ed. |
Source of information | | The subject of the PFD | region | - | - | | Year | year | - | - | | Dependent variable | | The number of self-employed | selfemployed | dude. | The official website of the Federal Tax Service of Russia/Unified Register of small and medium-sized businesses | | Explanatory variables | | The number of individual entrepreneurs – small and medium-sized businesses | individual entrepreneurs | dude. | The official website of the Federal Tax Service of Russia/Unified Register of small and medium-sized businesses |
| The number of unemployed aged 15 and over | unemployed | dude. | Official website of the Federal State Statistics Service/Human resources | | Gross regional product by subjects of the Russian Federation (PFD) (in current prices) | GRP | million rubles . | Official website of the Federal State Statistics Service/ National Accounts | | The average monthly nominal accrued wages of employees for a full range of organizations in the economy as a whole by subjects of the Volga Federal District | nominalsalary | r. | Official website of the Federal State Statistics Service/ Labor market, employment and wages | | Tax on professional income Budget execution by revenue | professional incometax | billion rubles . | The official website of the Unified portal of the budget system of the Russian Federation Electronic budget/ Budget execution by revenue /Revenue by budget classification codes/ Budget classification code 10506000010000110 (Professional Income tax) | All data were collected for the period 2020-2022 for 14 subjects of the Volga Federal District. This period is explained by the fact that the experiment on the introduction of a special tax regime "Tax on professional income" extended its effect to the entire territory of the Russian Federation starting from the second half of 2020. Thus, we have panel data containing information on 252 observations. It is also important to note that all data is collected for all time periods and has no gaps, which will allow us to conclude that the panel is balanced.
Next, for each variable, we calculate descriptive statistics (mean, median, mode) and variances (standard deviation, span). This provides an overview of the value distribution for each variable and allows you to identify obvious patterns or outliers for the variables under study. The results are presented in Table 2. Table 2 Descriptive statistics | Variable | Average | Median | art. off. | Mines. | Max. | | selfemployed | 48100,00 | 31546,00 | 51451,00 | 2024,00 | 234?310,00 | | individualentrepreneurs | 43917,00 |
35113,00 | 23488,00 | 11514,00 | 94033,00 | | unemployed | 43877,00 | 38493,00 | 22792,00 | 11699,00 | 111?660,05 | | GRP | 1?118?100,25 | 849?230,31 | 846?280,27 | 197?950,82 |
3?454?700,07 | | nominalsalary | 39848,00 | 39649,00 | 5627,80 | 31105,00 | 53234,00 | | professionalincometax | 0,12500 | 0,055000 | 0,18482 | 0,00000 | 0,94000 | Based on the results of descriptive statistics, several conclusions can be drawn. According to the self-employed indicator, the average number of NAP payers in the subjects of the Volga Federal District is 48,100.00 people, the median is 31,546.00 people, according to the individual entrepreneurs indicator, the average number of sole proprietors in the subjects of the Volga Federal District is 43,917.00 people, the median is 35,113.00, which tells us about the superiority of the number of NAP payers over the number of sole proprietors in some subjects of the Volga Federal District. The median number of unemployed in the subjects of the Volga Federal District is 38,493.00 people. The average GRP (GRP) and the average monthly nominally accrued salary (nominal salary) amount to 1,118,100.25 million rubles and 39,848.00 rubles, respectively. The median income of the regional budgets of the Volga Federal District from the NPD (professional income tax) is 0.055 billion rubles.
To study the multiple relationships between the variables under study and determine the strength of this relationship, we will use the method of correlation analysis. Correlation analysis is a method that allows us to determine the closeness of the relationship between the effective and factorial features, in our case, between the dependent and the group of explanatory variables. The Pearson correlation coefficient takes values from -1 to +1. The closer to 1, the stronger the linear relationship between the variables. The Student's criterion is used to assess the significance of the correlation coefficient. To do this, it is necessary to compare the correlation coefficient with a critical value, the value of which depends on the sample size and the level of significance. If the actual value of the correlation coefficient is greater than the critical value, it can be concluded that the correlation coefficient is reliable (or significant). The correlation matrix illustrates the relationship between variables. The correlation matrix also has the following properties: symmetry (its elements on the main diagonal are equal to 1, and the remaining elements are symmetrical relative to the main diagonal), correlation values (ranging from -1 to +1), independence of variables (if the correlation value between a pair of matrix elements is 0, then they are independent of each other). Let's build a correlation matrix based on the available group of indicators using the Gretl software product. Table 3 The correlation matrix 5% critical value (double-sided) = 0.3044 | selfemployed | individualentrepreneurs | unemployed | GRP | nominalsalary | professionalincometax | Indicators | | 1,0000 | 0,8252 | 0,3322 | 0,8740 |
0,8283 | 0,9611 | selfemployed | | | 1,0000 | 0,7871 | 0,9534 | 0,6746 | 0,7050 | individualentrepreneurs | | | | 1,0000 | 0,6674 | 0,2413 | 0,1866 |
unemployed | | | | | 1,0000 | 0,6764 | 0,7837 | GRP | | | | | | 1,0000 | 0,7596 | nominalsalary | | |
| | | | 1,0000 | professionalincometax | Let's present the indicators and their values indicated in Table 3 in the form of a heat map (see Fig. 1). 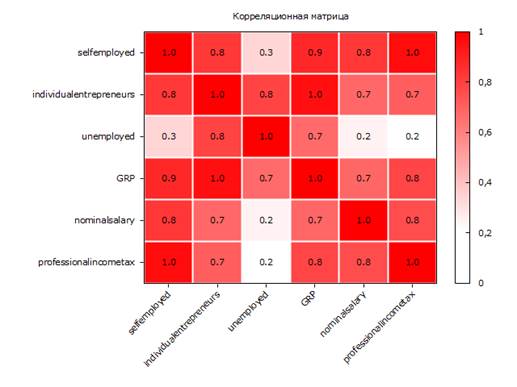
Fig. 1. Heat map (compiled by the author according to Table 3) According to Table 3 and Fig. 1, the following conclusion can be drawn: since the critical value for checking the significance of the correlation coefficient is 0.3044, therefore, the values of the correlation matrix that are above the critical value are reliable. The correlation values between the nominalsalary and unemployed indicators and the professionalincometax and unemployed indicators are not reliable. Further analysis of the correlation matrix shows that the greatest relationship between self-employed and professional income tax is 0.9611, as well as between GRP and individual entrepreneurs - 0.9534. The least reliable relationship can be traced between the indicators of unemployed and self-employed - 0.3322. At this stage of the study, it can already be concluded that there is a close linear relationship between the estimated socio-economic indicators and the change in the number of NAP payers.
Multiple regression models Next, let's move on to building a model of multiple linear regression on panel data. The model has the form: selfemployed – dependent variable;  ; ;  ; ;  ; ;  ; ;  – explanatory variables; – explanatory variables;
 – unknown model parameters; – unknown model parameters;
i – the PFD region; t – year;  – an accidental mistake. – an accidental mistake.
Let's build a model of multiple linear regression using the least squares method (combined regression model or pooled model). Model 1: Pooled Dependent variable: selfemployed | | Ratio | St. error | t-statistics | p-value | |
| const | ?35532,1 | 12051,5 | ?2,948 | 0,0056 | *** | | individualentrepreneurs | 1,25275 | 0,275571 | 4,546 | <0,0001 | *** | | unemployed | ?0,643436 | 0,156175 |
?4,120 | 0,0002 | *** | | GRP | 0,00509074 | 0,00508857 | 1,000 | 0,3238 | | | nominalsalary | 0,870544 | 0,345706 | 2,518 | 0,0164 | ** | | professionalincometax |
131727 | 16111,6 | 8,176 | <0,0001 | *** | The coefficient is significant "..." * at the level of 5%; ** at the level of 1%, *** at the level of 0.1%. | The average is frozen. changes'. | 48100,24 | | St. off. It's frozen. changes'. | 51451,31 | | The amount of sq. m. leftovers | 17300,00 | | St. model error | 6936,494 |
| R-square | 0,984041 | | Fixed. R-square | 0,981824 | | F(5, 36) | 443,9559 | | P-value (F) | 0 | | Log. plausibility | ?427,8294 | | Crete. Akaike | 867,6589 | | Crete. Schwartz |
878,0849 | | Crete. Hennan-Quinn | 871,4804 | | the rho parameter | 0,204035 | | Stat. Durbin-Watson | 0,886080 | According to this model, a number of the following conclusions can be drawn: 1) According to the individual entrepreneurs indicator, regions with a large number of individual entrepreneurs (for each unit) have a large number of NAP payers (by 1.25 units), this is also due to the fact that sole proprietors can combine a special tax regime "Professional income tax" with other tax regimes; 2) According to the unemployed indicator, regions with a large number of unemployed people have a smaller number of NAP payers (each additional unemployed person reduces the number of NAP payers by 0.64 units).; 3) According to the GRP indicator, (GRP) – it does not significantly affect the change in the number of NAP payers and, in general, is not significant; 4) According to the nominal salary indicator, regions with a higher average nominal salary have a large number of NAP payers; 5) According to the professional income tax indicator, it is expected that the growth in the number of NAP payers occurs in proportion to the increase in the amount of regional budget revenues. The analysis of the R-squared coefficient shows that the analyzed variables in total have (explain) 98% influence on the change in the number of NAP payers. An analysis of the F value of statistics shows us that at a 1% significance level, the equation as a whole is significant, which allows us to reject the hypothesis that there is no connection between the variables. To reduce the variation in values, we prolog the variables: GRP and professional income tax, and re-build the model with updated data. Model 2: Pooled
Dependent variable: selfemployed (with logarithms) | | Ratio | St. error | t-statistics | p-value | | | const | 97908,2 | 113560 | 0,8622 | 0,3962 | | | individualentrepreneurs | 3,15556 | 0,424019 |
7,442 | <0,0001 | *** | | unemployed | ?1,56664 | 0,265477 | ?5,901 | <0,0001 | *** | | nominalsalary | 1,03342 | 0,786461 | 1,314 | 0,1999 | | |
ln(GRP) | ?11182,9 | 9048,58 | ?1,236 | 0,2271 | | | ln(professionalincometax) | 3794,12 | 4543,67 | 0,8350 | 0,4110 | | The coefficient is significant "..." * at the level of 5%; ** at the level of 1%, *** at the level of 0.1%. | The average is frozen. changes'. | 59606,09 | | St. off. It's frozen. changes'. |
52467,96 | | The amount of sq. m. leftovers | 4?190?,00? | | St. model error | 12460,15 | | R-square | 0,952415 | | Fixed. R-square | 0,943603 | | F(5, 36) | 108,0805 | | P-value (F) |
0 | | Log. plausibility | ?354,7135 | | Crete. Akaike | 721,4270 | | Crete. Schwartz | 730,4061 | | Crete. Hennan-Quinn | 724,4482 | | the rho parameter | ?0,088736 | | Stat. Durbin-Watson | 1,298845 |
Based on the results of the construction of model 2, we see that the R-squared coefficient is less than in model 1, 0.95<0.98, therefore, we can conclude that model 1 has a high degree of reliability. The economic meaning of the results obtained from the review of Model 1 and model 2 contains a number of important conclusions. Firstly, in the subjects of the Russian Federation included in the Volga Federal District, in which the development of the sphere of microenterprise is observed, there is a synergistic effect of increasing the number of NAP payers. Secondly, the decrease in the number of unemployed in these subjects of the Russian Federation is also interconnected with an increase in the number of NAP payers. Thirdly, in regions with higher average nominal wages, there is also a noticeable increase in the number of NAP payers. Fourth, the economic situation of the subjects of the Volga Federal District, estimated by the GRP indicator, does not affect the change in the number of NAP payers. Fifthly, the growth of revenues of the regional budgets of the subjects of the Russian Federation included in the Volga Federal District in the form of income from the NAP has a close positive correlation with the number of NAP payers. Further, to clarify and further verify the obtained conclusions, we will construct models with random and fixed effects [27]. Fixed-effect models (fixedeffects) are usually used to estimate the average influence of a variable in a group, in this type of model, the error characterizes unobservable temporary effects, and is considered as fixed effects (temporal or spatial). In models with random effects, the error is considered as random effects (temporal or spatial). In accordance with econometric practice, to build models and study regions, a fixed-effect model is built and evaluated, where each region has its own individual characteristics. A fixed-effects model allows you to estimate the effects of past values of a variable on future values of that variable. In addition, since the subjects of the PFD in our sample are not homogeneous, and it is impossible to fully take into account these differences, therefore, the presence of certain fixed effects should be assumed. Fixed effects in this model will be indicated for  and presumably correlated with explanatory variables. and presumably correlated with explanatory variables. The model with fixed effects has the following form: selfemployed – dependent variable; ; ; ; ; – explanatory variables; – unknown model parameters; i – the PFD region; t – year; – an accidental error;  – fixed effects of regions. – fixed effects of regions.
The results of constructing a model with fixed effects Model 3: Fixed Effects
Dependent variable: selfemployed | | Ratio | St. error | t-statistics | p-value | | | const | ?25757,1 | 17028,6 | ?1,513 | 0,1440 | | | individualentrepreneurs | 1,15020 | 0,274952 |
4,183 | 0,0004 | *** | | unemployed | ?0,638003 | 0,158152 | ?4,034 | 0,0005 | *** | | nominalsalary | 0,596266 | 0,500691 | 1,191 | 0,2458 | | |
professionalincometax | 122698 | 17154,9 | 7,152 | <0,0001 | *** | | GRP | 0,0109474 | 0,00557651 | 1,963 | 0,0618 | * | The coefficient is significant "..." * at the level of 5%; ** at the level of 1%, *** at the level of 0.1%. | The average is frozen. changes'. | 48100,24 | |
St. off. It's frozen. changes'. | 51451,31 | | The amount of sq. m. leftovers | 80 200,0 | | St. model error | 5904,247 | | LSDV R-square | 0,992613 | | Within the R-square | 0,990102 | | LSDV rating: F(18, 23) | 171,6940 | | P-value (F) |
0 | | Log. plausibility | ?411,6537 | | Crete. Akaike | 861,3074 | | Crete. Schwartz | 894,3231 | | Crete. Hennan-Quinn | 873,4089 | | the rho parameter | ?0,488561 | | Stat. Durbin-Watson |
1,814202 | According to the above model, several important conclusions can be drawn: 1) the nominalsalary coefficient in the fixed-effects model turned out to be statistically insignificant, therefore, the size of the average monthly nominal accrued salary in the subjects of the Volga Federal District does not significantly affect the change in the number of NAP payers; 2) the GRP coefficient in the fixed-effects model begins to influence the number of NAP payers in the subjects of the Volga Federal District at the level of 5%. This study also considered models with fixed and random effects with time effects included in the form of dummy variables (dummyvariable), the Wald criterion was used for their significant effect, and the choice between models with fixed and random effects was carried out using the Hausman criterion [27]. Taking into account the fact that there are individual fixed regional characteristics of each studied subject of the Russian Federation, which is part of the Volga Federal District, we need to adjust the conclusions obtained based on the combined assessment of model 1, model 2 and model 3, changing our opinion about the importance of socio-economic indicators of average nominal accrued wages and GRP on the number of NAP payers. The decrease in the influence of one indicator and the increase in the influence of another in the model with fixed effects confirms the presence of regional features. To compare model 1 (pooled regression model or pooled model) and model 3 (fixed effects model), it is necessary to conduct the Wald test [28] for linear constraints, which includes the following hypotheses: - null hypothesis H0 – select a (pooled) model; - an alternative hypothesis FOR – choosing a model with fixed effects. In our case: test statistics: F(13, 23) = 20.5294, p-value = P(F(13, 23) > 2,05294) = 0,00636977. Since p= 0.00636977 is less than the significance level of 0.05, we accept an alternative hypothesis, therefore, the hypothesis is confirmed, which allows us to conclude that there are individual effects of model 3. Next, we will build and test a model with random effects. This model assumes that the unobservable effects are not correlated with the explanatory variables. Also, in this model, it is possible to evaluate regressors that do not change over time, which could not be done in a model with fixed effects. In fact, the model uses the fact that some factors affecting the result may randomly differ from one object to another. The model with random effects has the following form: selfemployed – dependent variable; ; ; ; ; – explanatory variables;
– unknown model parameters; i – the PFD region; t – year; – an accidental error;  – random effects. – random effects.
To build a model with random effects based on the available panel data, we will use the Gretl software product. Model 4: Random Effects (GLS) Dependent variable: selfemployed | | Ratio | St. error | z | p-value | | | const | ?33816,6 | 11813,7 | ?2,862 | 0,0042 |
*** | | individualentrepreneurs | 1,20091 | 0,245441 | 4,893 | <0,0001 | *** | | unemployed | ?0,650543 | 0,138970 | ?4,681 | <0,0001 | *** | | nominalsalary | 0,829171 |
0,339718 | 2,441 | 0,0147 | ** | | professionalincometax | 127382 | 14900,2 | 8,549 | <0,0001 | *** | | GRP | 0,00783190 | 0,00470735 | 1,664 | 0,0962 | * |
The coefficient is significant "..." * at the level of 5%; ** at the level of 1%, *** at the level of 0.1%. | The average is frozen. changes'. | 48100,24 | | St. off. It's frozen. changes'. | 51451,31 | | The amount of sq. m. leftovers | 1?750,00 | | St. model error | 6880,351 | | Log. plausibility | ?428,0635 | | Crete. Akaike | 868,1270 | |
Crete. Schwartz | 878,5530 | | Crete. Hennan-Quinn | 871,9485 | | the rho parameter | ?0,488561 | | Stat. Durbin-Watson | 1,814202 | According to this model, it can be concluded that the GRP and nominalsalary coefficients in the model with random effects are statistically significant. Assuming the presence of unobservable effects that are not correlated with the analyzed socio-economic indicators in the subjects of the Volga Federal District, we see that in model 4 the significance of the influence of average nominal accrued wages on the change in the number of NAP payers has been restored, and the influence of GRP on the dependent variable has also become noticeable. We will perform the Broich-Pagan test [28] to check the presence or absence of heteroskedasticity in the above model. This test allows you to compare Model 1 (Pooled model) and model 4 (Random Effects (GLS)), and the following null and alternative hypotheses are used in this test: - null hypothesis H0 – select a (pooled) model; - an alternative hypothesis FOR – choosing a model with random effects. In our example: asymptotic test statistics: Chi-squared(1) = 2.93929, p-value = 0.0864489 is greater than the significance level of 0.05, therefore, we accept the hypothesis H0. According to the final assessment of the Broich-Pagan test, it can be concluded that the null hypothesis is confirmed, the variance of observation-specific errors is 0, therefore, model 4 is less significant than model 1. Also, to compare models with fixed and random effects, we will use the Hausmann test [28]. The following null and alternative hypotheses are used in this test:
- null hypothesis H0 – choosing a model with random effects; - an alternative hypothesis FOR – choosing a model with fixed effects. Asymptotic test statistics: Chi-squared (5) = 23.3015, p-value = 0.0801828 is less than the significance level of 0.1, therefore, the alternative hypothesis is confirmed, the model with fixed effects is more reliable. Based on the results of the conducted comparative tests, it can be concluded that the best model is a model with fixed effects, which characterizes the individual characteristics of regions that distinguish regions from each other. conclusion Based on the results of the econometric study, it can be concluded that the socio-economic indicators of the subjects of the Volga Federal District have a noticeable impact on the number of NAP payers in these regions, namely: individualentrepreneurs, unemployed and professionalincometax. The hypothesis of the study is confirmed. 1) individualentrepreneurs – the number of individual entrepreneurs (people) has a positive relationship with the number of NAP payers, which allows us to conclude that in regions with a large number of sole proprietors, the number of NAP payers is also growing; 2) unemployed – the number of unemployed aged 15 years and older (people) has an inverse relationship, therefore, the fewer unemployed there are in the subject of the Volga Federal District, the more NAP payers there are; 3) professionalincometax – tax on professional income, budget execution by income (billion rubles), is expected to have a direct relationship with the number of NAP payers in the subjects of the Volga Federal District; 4) Such indicators as GRP – gross regional product by subjects of the Russian Federation (PFD) (in current prices; million rubles) and nominalsalary – average monthly nominal accrued wages of employees for a full range of organizations in the economy as a whole by subjects of the PFD (R.) do not significantly affect the number of NAP payers. In general, the approach to quantifying the mutual impact of socio-economic indicators on the number of NAP payers in the subjects of the Russian Federation included in the Volga Federal District can be used in the formation of a budget and tax policy program, both at the federal and regional levels in the Russian Federation, as well as in countries near and far abroad. A similar approach to assessing the effects of the introduction of special tax regimes can also be used to assess the achievement of goals under other special tax regimes applicable to individuals aimed at stimulating and developing entrepreneurial activity. In addition, with the help of various macroeconomic instruments, it is possible to exert targeted influence on various socio-economic indicators in order to increase the positive effects of the introduced tax regimes. [1] Federal Law "On conducting an experiment to establish a special tax regime "Tax on professional income" dated 11/27/2018 No. 422-FZ. [2] [Electronic resource] URL: https://sozd.duma.gov.ru/bill/551845-7 The official website of the Legislative Support System / Bill No. 551845-7/ Explanatory note to the bill / (date of reference: 10/29/2023). [3] [Electronic resource] URL: https://59.rosstat.gov.ru/folder/160975 # Official website of the Federal Tax Service of Russia/Unified Register of Small and medium-sized Businesses/ (date of application: 10/29/2023) [4] [Electronic resource] URL: https://rosstat.gov.ru/folder/12781 Official website of the Federal State Statistics Service/Demography/Population size and composition/ (accessed: 10/29/2023)
References
1. Goetz, S., Fleming, D., & Rupasinga, A. (2012). Economic consequences of self-employment. Journal of Agricultural and Applied Economics, 44(3), 315-321. doi:10.1017/S1074070800000432
2. Juan Herreño, Sergio Ocampo. (2023). Macroeconomic implications of subsistence self-employment. Journal of Monetary Economics, 136, 91-106. Retrieved from https://doi.org/10.1016/j.jmoneco.2023.02.002
3. Ogembo D., “Taxation of Self-Employed Professionals in Africa: Three Lessons from a Kenyan Case Study” [2020] (Institute of Development Studies) ICTD African Tax Administration Working Paper Series, WP 17. Retrieved from https://ssrn .com/abstract=3801878 or http://dx.doi.org/10.2139/ssrn.3801878
4. Luo, B., & Chong, T.TL. Regional differences in self-employment in China. Small Bus Economics, 53, 813-837 (2019). Retrieved from https://doi.org/10.1007/s11187-018-0063-z
5. Batrancha, L.M., Nikita, A., De Agostini, R., et al. (2022). An experimental study of self-employed taxpayers on trust, power and tax compliance in eleven countries. Financ Innov 8, 96. Retrieved from https://doi.org/10.1186/s40854-022-00404-y
6. Ken, E. (2022). Income taxation, entrepreneurship and self-employment registration status. Int Tax Public Finance 29, 1260-1293. Retrieved from https://doi.org/10.1007/s10797-021-09702-0
7. Bozzon R., & Murgia A. (2022). Independent or dependent? European labor statistics and their (in)ability to identify forms of dependence in self-employment. Soc Indic Res 160, 199-226. Retrieved from https://doi.org/10.1007/s11205-021-02798-1
8. Williams, K.S., & Gorodnich, A.V. (2019). Assessing the prevalence and working conditions of dependent self-employment in the European Union. Vlahos V, Bitzenis A (eds) European Union. Palgrave Macmillan, Cham. Retrieved from https://doi.org/10.1007/978-3-030-18103-1_7
9. Spasova, S., Buje, D., Gailani, D., & Vanherke, B. (2019). Self-employment and social protection: understanding the differences between social security regimes. Journal of Poverty and Social Justice, 27(2), 157-175. Retrieved November 18, 2023. Retrieved from https://doi.org/10.1332/175982719X15538492348045
10. Kustov, N. A. (2023). Tax on professional income: development forecast and assessment of the impact on the tax system of the Russian Federation. Tax policy and practice, 10(50), 56-60.
11. Trusova, N. S. (2019). The influence of tax policy on the regional economy. International accounting, 12(462), 1419-1433. doi:10.24891/ia.22.12.1419
12. Rakhmatullina, O. V. (2016). Principles of application of special tax regimes in the Russian Federation. New science: From idea to result, 1-3, 203-206.
13. Bochkova, A. A. (2023). Legal assessment of special tax regimes in the Russian Federation. People. Socium. Society, S1, 95-99.
14. Kazmin, A. G. (2022). Assessment of the fiscal function of special tax regimes. Financial Bulletin, 3(58), 43-48.
15. Khizhak, N. P. (2020). Forecast assessment of tax revenues of budgets when applying special tax regimes. Taxes and taxation, 1, 16-28. doi:10.7256/2454-065X.2020.1.32521
16. Pavlova, E. V. (2023). The influence of the tax on professional income on the development of small business in the region. Current state of economic systems: management, development, security: Collection of scientific papers of the III International Scientific and Practical Conference. Tver, 20 December 2022. P. 94-96. Tver: Tver State Technical University.
17. Chekmarev, O. P. (2022). Payers of tax on professional income: place in the labor market and role in the economy. Current issues and vectors of development of modern science and technology. Petrozavodsk: International Center for Scientific Partnership “New Science” (IP Ivanovskaya I.I.). P. 226-241.
18. Zhukova, T.V. (2022). International experience in financing pensions for the self-employed. Finance: theory and practice, 1, 169-185. doi:10.26794/2587-5671-2022-26-1-169-185
19. Kustov, N. A. (2021). Approaches and methods for assessing the budgetary efficiency of introducing a tax on professional income in the constituent entities of the Russian Federation. Perm Financial Journal, 1(24), 32-49.
20. Kustov, N. A. (2023). Features of taxation of the self-employed in countries near and far abroad. Perm region. Strategy in global uncertainty. From mining plants to technologies of the future: Materials of the VII Perm Economic Congress, Perm, February 02–03, 2023. P. 253-260. Perm: Perm State National Research University.
21. Kustov, N. A. (2020). Introduction of a tax on professional income in the constituent entities of the Russian Federation: analysis of positive effects and risks. Perm Financial Journal, 2(23), 46-61.
22. Abramova, E. A. (2020). Self-employment as a tool for reducing unemployment during the crisis. Economics and business: theory and practice, 11-1(69), 9-12. doi:10.24411/2411-0450-2020-10853
23. Zvereva, T.V. (2020). The role of digitalization in the tax administration of self-employed citizens. Bulletin of IPB (Bulletin of Professional Accountants), 6, 35-39.
24. Doroshenko, S. V. (2023). State policy and the structure of income of the population: an experiment with self-employment. Ars Administrandi (The Art of Management), 2, 338-352. doi:10.17072/2218-9173-2023-2-338-352
25. Kustov, N. A. (2022). Tax on professional income as a preferential system of taxation of individuals: a conceptual approach. Tax policy and practice, 6(234), 76-80.
26. Baltagi, B. (1995). Economic Analysis of Panel Data. John Wiley & Sons; Deaton, A. (1985). Panel Data from Series of Cross-Sections. Journal of Econometrics, 30, 109-126; Ratnikova, T. A., Furmanov, K. K. (2014). Analysis of panel data and data on the duration of states. Moscow: Publishing house. House of the Higher School of Economics.
27. Baltagi, B. Economic Analysis of Panel Data. John Wiley & Sons, 1995.
28. Deaton, A. Panel Data from Series of Cross-Sections. Ratnikova T. A., Furmanov K. K. Analysis of panel data and data on the duration of states.
29. Kustov, N.A. The influence of the special tax regime "Tax on professional income" on the socio-economic indicators of the subjects of the Russian Federation: setting hypotheses. Collection of articles based on the materials of the All-Russian Scientific and practical conference (Perm, PSNIU, October 16-17, 2023) (pp. 76-81).
First Peer Review
Peer reviewers' evaluations remain confidential and are not disclosed to the public. Only external reviews, authorized for publication by the article's author(s), are made public. Typically, these final reviews are conducted after the manuscript's revision. Adhering to our double-blind review policy, the reviewer's identity is kept confidential.
The list of publisher reviewers can be found here.
The subject of the study. Based on the title, the article should be devoted to assessing the impact of socio-economic indicators of the subjects of the Volga Federal District on the number of payers of the special tax regime "Professional income tax". First of all, it should be noted that the subjects are not from the federal district, but from the Russian Federation. When correcting an article, the author is recommended to clarify the title. Moreover, the methodology presented in the text of the article is applicable to the subjects of the Russian Federation located in other subjects of the Russian Federation. Therefore, the current headline obviously limits the potential readership. The content of the article in this context is broader than the stated title. The research methodology is based on the use of both general scientific methods (analysis, synthesis, induction, deduction) and specialized economic and mathematical ones (in particular, multiple regression models were built). It is valuable that the author uses a graphical method of presenting the results obtained, but at the same time weakly accompanies the mathematical calculations obtained with economic analysis. The relevance of the study of issues related to regional development is beyond doubt and is associated with the fact that a well-organized tax system is important not only in fiscal refraction, but also in stimulating the socio-economic development of the state. The scientific novelty in the materials submitted for review is present and is related to the mathematical models constructed by the author. The economic aspect of scientific novelty was not found in the reviewed article due to the lack of relevant conclusions after the mathematical block. Style, structure, content. The style of presentation is scientific. The structure of the article is built by the author, which allows you to reveal the stated topic. Familiarization with the content of the article showed that the author worked out the theoretical basis of the study quite well, but subsequently did not compare the results obtained with those already contained in the scientific literature. The author also justified the constructed mathematical models in sufficient detail. At the same time, it would be interesting to know what conclusions follow from this? How exactly do socio-economic indicators affect the number of taxpayers using the special tax regime under consideration? How can the results obtained be applied in the practical activities of the Federal Tax Service or specific taxpayers? Bibliography. The bibliographic list consists of 29 titles. It is valuable that the author uses not only domestic, but also foreign scientific publications. A positive impression is also formed due to the fact that the list of sources contains relevant scientific publications (2022-2023). Appeal to opponents. Despite the author's list of sources, no scientific discussion was found in the text of the article. When correcting the content of the article, it is recommended to discuss the results obtained with the results of the study contained in other authors. This will allow you to clearly show the increase in scientific knowledge. Conclusions, the interest of the readership. Taking into account all the above, we conclude that the article will be of interest to a fairly wide range of potential readership, provided that the comments indicated in the text of the review are taken into account (especially in terms of correcting the title and accompanying mathematical calculations with financial and economic conclusions).
Second Peer Review
Peer reviewers' evaluations remain confidential and are not disclosed to the public. Only external reviews, authorized for publication by the article's author(s), are made public. Typically, these final reviews are conducted after the manuscript's revision. Adhering to our double-blind review policy, the reviewer's identity is kept confidential.
The list of publisher reviewers can be found here.
The reviewed article is devoted to the study of the influence of socio-economic indicators of the subjects of the Russian Federation, which are part of the Volga Federal District (PFD), on the number of payers of the special tax regime "Professional income tax". The research methodology is based on the generalization of information about the evolution of self-employment in the Russian Federation and the expansion of the tax on professional income, the use of data analysis methods, correlation and regression analysis in relation to a sample of panel data from 2020 to 2022 (252 observations) and visualization of the calculation results obtained using the Gretl software product. The authors rightly attribute the relevance of the work to the fact that the number of payers of professional income tax in the subjects of the Volga Federal District exceeds 1 million people and is increasing, therefore, the study of the relationship between socio-economic development and the number of payers of this tax seems timely. The scientific novelty of the work, according to the reviewer, lies in the author's conclusions that a quantitative assessment of the mutual influence of socio-economic indicators and the number of payers of professional income tax in the subjects of the Russian Federation included in the PFD can be used in the formation of a budget and tax policy program. The following sections are structurally highlighted in the article: Introduction, Theoretical foundations of the study, Research results, Multiple regression models, Conclusion, Bibliography. The article evaluates the development of the professional income tax, expressed in an increase in the number of payers of this tax regime, depending on the dynamics of regional socio-economic indicators. This mutual dependence is considered as a tool of tax policy that has an impact on the economy of a region, district or the whole country. The publication presents the results of descriptive statistics of a sample population: minimum, maximum and average values of features, median, standard deviation; a correlation matrix is presented and the values of paired correlation coefficients are analyzed using a visualization tool – a heat map; four models are constructed and the simulation results are analyzed. If it is impressive, the authors strive for an economic interpretation of the obtained numerical values of the model parameters and individual criteria. The bibliographic list includes 29 sources – scientific publications of domestic and foreign scientists on the topic under consideration, Internet resources. The text of the publication contains targeted references to the list of references confirming the existence of an appeal to opponents. The approach presented in the publication to the causal relationships between the level of development of regions and the number of taxpayers is debatable, since it is possible to pose the opposite problem: the impact of the number of taxpayers on the socio-economic development of the region. Unfortunately, the article does not focus on the multicollinearity of the factors included in the multiple regression model. The topic of the article is relevant, the material reflects the results of the research conducted by the authors, contains elements of increment of scientific knowledge, corresponds to the topic of the journal "Finance and Management", may arouse interest among readers and is recommended for publication.
|


