|
Finance and Management
Reference:
Koshkin A.V., Shcheglov M.Y., Bit-Zaya G.A., Kalinichenko A.S., Mikhaleva D.M.
Anti-Crisis Industrial Policy of the Constituent Entities of the Russian Federation during the COVID-19 Pandemic
// Finance and Management.
2024. ą 1.
P. 12-38.
DOI: 10.25136/2409-7802.2024.1.69641 EDN: GZQLQG URL: https://en.nbpublish.com/library_read_article.php?id=69641
Anti-Crisis Industrial Policy of the Constituent Entities of the Russian Federation during the COVID-19 Pandemic
Koshkin Andrey Vyacheslavovich
ORCID: 0000-0001-9942-7722
Postgraduate student, Department of Economic Theory and Economic Policy, St. Petersburg State University
199034, Russia, Saint Petersburg, nab. University, 7-9

|
a.koshkin@spbu.ru
|
|
 |
Shcheglov Maksim Yur'evich
ORCID: 0000-0003-1388-520X
Master’s Student, Department of Economic Theory and Economic Policy, St. Petersburg State University
199034, Russia, Saint Petersburg, nab. University, 7-9
|
|
st069668@student.spbu.ru
|
|
|
Other publications by this author
|
|
Bit-Zaya George Aleksandrovich
ORCID: 0009-0007-9126-5846
Student, Department of Political Institutions and Applied Political Research, St. Petersburg State University
199034, Russia, Saint Petersburg, nab. University, 7-9
|
|
st094247@student.spbu.ru
|
|
|
Kalinichenko Anastasia Sergeevna
ORCID: 0009-0006-4789-9924
Student, Department of Political Administration, St. Petersburg State University
199034, Russia, Saint Petersburg, nab. University, 7-9
|
|
st089468@student.spbu.ru
|
|
|
|
Mikhaleva Diana Maksimovna
ORCID: 0009-0000-4027-6579
Student, Department of Constitutional Law, St. Petersburg State University
199034, Russia, Saint Petersburg, nab. University, 7-9
|
|
st107486@student.spbu.ru
|
|
|
|
DOI: 10.25136/2409-7802.2024.1.69641
EDN: GZQLQG
Received:
21-01-2024
Published:
23-02-2024
Abstract:
The COVID-19 pandemic was one of the first “black swan” for the global economy. Regional authorities in Russia were faced to support their regional economies but they were faced with uncharacteristic independence. The issue of assessing the effectiveness of regional anti-crisis industrial policy measures in Russia during the COVID-19 crisis is becoming urgent. The purpose of this study is to search for the most successful measures of regional support in Russia during the designated period. The study is based on the conceptual framework of the St. Petersburg School of Industrial Policy. Descriptive statistics, cluster analysis, and correlation analysis are used as statistical methods of analysis. 1196 anti-crisis industrial policy measures were classified in all 85 regions of the Russian Federation. A scatter diagram of regions was constructed with indicators of the scale for assessing the intensity of the anti-crisis industrial policy and the scale of the impact of the crisis on socio-economic indicators. Four clusters were identified: (1) regions that practically did not implement an anti-crisis industrial policy and suffered during the crisis; (2) regions that have significant economic stability and are less likely to resort to active anti-crisis policies; (3) regions, the values of indicators of the dynamics of socio-economic indicators of which are at an average and below level, but are pursuing, on average, a more intensive anti-crisis policy; (4) regions that pursued an active anti-crisis industrial policy and achieved good socio-economic indicators. Correlation analysis did not reveal a stable connection between the intensity of the anti-crisis policy and the crisis dynamics of socio-economic indicators. The study also presents leading regions and outsider regions in terms of anti-crisis industrial policy measures for each of the 4 clusters.
Keywords:
regional economy, industrial policy, anti-crisis management, COVID-19, anti-crisis policy, regional policy, anti-crisis industrial policy, industrial policy measures, socio-economic development, coronavirus
This article is automatically translated.
introduction
The COVID-19 pandemic was one of the first, but certainly not the last "black swan" for the global economy. All the two years it took to write the works of this cycle, there has been a qualitative and quantitative increase in crisis factors. In these conditions, the study of the anti-crisis paradigm acquires both unconditional relevance and undeniable applied importance.
During the beginning of the pandemic, there was a sharp increase in measures that can be classified as anti-crisis industrial policy measures (in the resource-industry tradition of interpreting this term) both in the countries of the world [1] and regionally within Russia [2]. The very topic of industrial policy is very controversial in economic theory. It is safe to say that there are more than 15 different interpretations of the concept of "industrial policy", which contradict each other to one degree or another [3]. In a broad sense, most of these interpretations can be reduced to a dichotomy of institutional and resource-industry approaches to the interpretation of industrial policy.
The regional authorities in Russia faced a curious situation during the outbreak of the pandemic. On the one hand, they were faced with the need to make some managerial decisions to maintain their regional economies, and on the other hand, they faced uncharacteristic independence and a fundamentally different level of responsibility for the results of their activities [4]. At the same time, this stimulated the search for management solutions for anti-crisis response in regional governments and specialized commissions of regional legislative assemblies. In the context of the continuing resource constraints of regional budgets, the analysis of the range of developed measures to support regional economies is also important [5].
The COVID-19 pandemic period is localized in the dates from February 2020 to February 2022. We can say for sure that the main array of government support measures related to the outbreak of the pandemic was concentrated in the spring of 2020, but in order to identify more detailed follow-up support measures, the 2020 study period was extended to February inclusive. February 2022 is the month of the outbreak of hostilities, which overshadowed all the crisis significance of the pandemic. After February 2022, it is impossible to say whether this or that decision was aimed at alleviating the crisis factors of the pandemic or the consequences of military operations and related acts of economic discrimination of the Russian Federation within the global economy.
The very theory of the existence of anti-crisis industrial policy as a single transformational form of industrial policy for all other types has a fundamental scientific novelty. It seems that the analysis of significant empirical material within the framework of the theory of a particular type of anti-crisis industrial policy has a certain scientific value in terms of contribution to the verification of this theory.
METHODOLOGY AND METHODS
The methodological basis of this work is a wide range of works on industrial policy, including its theoretical conceptualization. Thus, this study is based on the theoretical models and concepts of industrial policy by F.F. Rybakov [6], D. Rodrik [7; 8; 9; 10] and a representative of the St. Petersburg School of Industrial Policy V.Y. Pashkus [11]. With regard to the essence of anti-crisis management and state anti-crisis regulation, the work is based on N.F. Chebotarev's monograph "State anti-crisis regulation and challenges of a new reality" [12], as well as on the research of Lishenko and Mechikova [13].
Modern research on industrial policy is mainly based on two approaches: resource-based and institutional [14]. Among the authors who adhere to the resource-industry approach are: M. Okuno-Fujiwara, K. Suzumura [15], L. Otis, J. Graham [16], F.F. Rybakov [17], V.Y. Pashkus, A.B. Asadulaev and J.A. Aliaskarova [18]. The institutional approach to the interpretation of the concept of "industrial policy" is followed by J. Forman-Peck, J. Frederico J. [19], D. Rodrik, A.I. Tatarkin and O.A. Romanova [20], N.D. Kondratiev [21].
An important part of the terminological apparatus of this work is the concept of "anti-crisis industrial policy". In this study, the authors will understand anti-crisis industrial policy as "a set of public policy measures aimed at compensating for the crisis effects in relation to the framework conditions for business entities in industry, as well as similar measures to minimize the negative effect of the expected crisis in the future."
This definition is formulated in the tradition of the St. Petersburg School of Industrial Policy and in the paradigm of the resource-industry approach to the interpretation of the concept of "industrial policy". The resource-industry approach generally corresponds to the most common understanding of the term "industrial policy" in Western economics and intersects with the terms "sectoral" or "sectoral" policy, which involves government actions aimed at supporting or developing specific sectors and sectors of the economy. In addition, the interpretations contained in presidential decrees, federal laws and government programs also reflect the position of the resource-industry approach rather than an alternative institutional one. The May 2018 decrees of the President of the Russian Federation (On national goals and strategic objectives for the development of the Russian Federation for the period up to 2024: Decree of the President of the Russian Federation), FZ-N488 "On Industrial Policy of the Russian Federation" and the Concept of Industrial Policy of St. Petersburg until 2025 can be cited as vivid examples of this.
During the study of various anti-crisis regulation measures in the countries of the world [1; 22], it was noted that, regardless of the type of industrial policy in force in a country, its range of anti-crisis industrial policy measures is similar to the same ranges of measures in other countries. In the course of this study, the experience of 9 countries in introducing 47 specialized solutions (measures) was analyzed. According to the results of a study of anti-crisis industrial policy in 9 countries and 32 regions of the Russian Federation during the COVID-19 pandemic, the most popular measures of anti-crisis industrial policy can be named: tax incentives, sectoral social benefits and benefits for municipal and state leases for small and medium-sized enterprises. Probably, the popularity of these specific measures was influenced by the nature of the crisis under study.
An analysis of the anti-crisis industrial policy of the Russian regions in a sample of 32 regions and 91 specialized solutions showed that the anti-crisis nature of industrial policy has changed the very range of decisions [23]. However, if in the case of countries it was possible to talk about a narrowing of the spectrum due to the heterogeneity of types of industrial policy, then in the framework of studying the anti-crisis industrial policy of the subjects of the Russian Federation, on the contrary, an expansion of the range of industrial policy measures was observed.
The variety of measures possible for state intervention at the level of a regional government or regional legislature must be reduced to a finite list. Within the framework of this study, the authors propose to identify the following measures of the economic policy of the region:
-
-
- benefits for renting regional and municipal property;
- tax benefits;
- financial and consulting support for exporters;
- grants to social entrepreneurs;
- direct financial support for business;
- lump-sum payments to certain categories of citizens;
- long-term payments to social workers;
- industry subsidies;
- deferred payments for housing and communal services;
- increased purchases from SMEs.
It is important to note that the inclusion in the definition of measures aimed at anticipating negative crisis effects is a debatable issue. Thus, such anti-crisis activities of the state are not tied to the transition to an anti-crisis industrial policy regime and can be carried out long before the crisis within the framework of the type of industrial policy adopted in the country. As the experience of studying anti-crisis monetary policy shows, the division of anti-crisis measures into proactive and reactive ones has research potential. In turn, the analysis of the typologization of various types of industrial policy confirms the applicability of the dichotomy of proactivity to the concept of industrial policy.
In the article, the proactivity or reactivity of certain measures is also important. To what extent does the regional government act as a anticipatory actor in a given situation, or are its actions dictated by a completely unavoidable need for their adoption? The government may limit itself solely to responding to the current problems of the industrial sector, or it may try to anticipate the development of the situation and solve the problem even before the first symptoms of the problem itself appear. Within the framework of the topic considered in this paper, most measures will obviously be aimed at eliminating the negative consequences of the COVID-19 pandemic, although the emergency mobilization of production capacities for the creation of a vaccine can indeed be defined as a measure aimed at directly eliminating the cause of the crisis.
THE RESULTS OF THE STUDY
To analyze the measures of regional anti-crisis policy, the entire general population of the regions of the Russian Federation was analyzed (85 regions for the period from 02/01/2019 to 02/01/2022). The total number of analyzed and typologized measures of anti-crisis industrial policy of the subjects of the Federation amounted to 1,196. A summary table of the frequency of use of types of anti-crisis industrial policy by federal districts of the Russian Federation was compiled (Table 1).
Table 1. Frequency of anti-crisis industrial policy measures by federal districts of the Russian Federation.
|
Classification type
|
Central Federal District
|
Northwestern Federal District
|
Southern Federal District
|
North Caucasus Federal District
|
PFD
|
UFA
|
SFO
|
Far Eastern Federal District
|
|
Financial and consulting support for exporters
|
87
|
65
|
20
|
28
|
10
|
13
|
31
|
48
|
|
Increasing purchases from SMEs
|
1
|
-
|
-
|
-
|
-
|
1
|
-
|
-
|
|
Direct financial support for business
|
121
|
109
|
8
|
8
|
22
|
9
|
14
|
69
|
|
Tax benefits
|
30
|
27
|
2
|
1
|
4
|
2
|
11
|
13
|
|
Industry subsidies
|
8
|
5
|
1
|
49
|
2
|
15
|
38
|
5
|
|
Benefits for renting municipal and regional property
|
17
|
6
|
8
|
15
|
2
|
2
|
9
|
7
|
|
One-time payments to certain categories of citizens
|
13
|
10
|
5
|
13
|
15
|
7
|
13
|
4
|
|
Long-term payments to social workers
|
22
|
7
|
11
|
32
|
15
|
11
|
17
|
2
|
|
Deferred payments for housing and communal services
|
9
|
8
|
1
|
9
|
-
|
-
|
21
|
8
|
Source: compiled by the authors based on an analysis of the websites of regional administrations.
It is worth noting the significant uneven distribution of the types of measures involved by the regions of the federal districts. This allows us to make an assumption about the influence of the factor of the federal district in the formation of the anti-crisis industrial policy of the region. This may be a consequence of a similar geographical location (especially relevant for the regions of the Far Eastern Federal District) or certain managerial traditions within the framework of supervising presidential plenipotentiaries in federal districts. The allocation of the "Increase in purchases from SMEs" type did not justify itself at all.
To assess the intensity of the anti-crisis industrial policy of the subjects of the Russian Federation, empirical material collected at the previous stage of the study was used. Thus, the number of anti-crisis industrial policy measures and the scale of anti-crisis industrial policy were taken into account. The scale was determined based on the volume of expenditures of the consolidated budget of the subject of the Russian Federation by sections (mobilization preparation of the economy, National Economy and Social Policy), divided into GRP for 2020 and 2021 at current prices, as well as the share of these expenditures in the consolidated budget of the subject of the Russian Federation for 2020 and 2021.. When calculating the fractions, rounding percentages to hundredths was used. So, 4 auxiliary indicators turned out: the share of expenses from GRP 2020, the share of expenses from GRP 2021, the share of these expenses in the consolidated budget of the subject of the Russian Federation for 2020 and 2021. Each of the auxiliary indicators was translated into a rating scale from 0 to 10. The final scale of measures is the sum of the scores of four indicators, transformed according to an auxiliary 4–point scale (insignificant (1) - small (2) – medium (3) – significant (4)).
For the final assessment of measures, the function of multiplying the indicator "number of measures" by "assessment of the scale of measures" was used, followed by conversion to a scale from 1 to 30, where 1 is the least intensive policy, and 30 is the most intensive. A table with the number of anti-crisis industrial policy measures and the final assessment on this scale are presented in the table below (Table 2).
Table 2. Measures of anti-crisis industrial policy of the regions and their assessment.
|
The subject of the Federation
|
Number of measures
|
Scale of measures (4-point scale)
|
Rating (index)
|
Transfer to a 30-point scale
|
|
The Central Federal District
|
|
Belgorod region
|
10
|
1
|
10
|
3
|
|
Bryansk region
|
4
|
3
|
12
|
3
|
|
Vladimir region
|
7
|
3
|
21
|
5
|
|
Voronezh Region
|
12
|
2
|
24
|
6
|
|
Ivanovo region
|
33
|
2
|
66
|
17
|
|
Kaluga Region
|
14
|
2
|
28
|
7
|
|
Kostroma region
|
14
|
2
|
28
|
7
|
|
Kursk region
|
17
|
2
|
34
|
9
|
|
Lipetsk region
|
24
|
2
|
48
|
12
|
|
Moscow
|
30
|
2
|
60
|
15
|
|
Moscow oblast
|
12
|
1
|
12
|
3
|
|
Oryol region
|
11
|
2
|
22
|
6
|
|
Ryazan region
|
48
|
2
|
96
|
24
|
|
Smolensk region
|
13
|
3
|
39
|
10
|
|
Tambov region
|
4
|
2
|
8
|
2
|
|
Tver region
|
10
|
2
|
20
|
5
|
|
Tula region
|
40
|
2
|
80
|
20
|
|
Yaroslavl region
|
5
|
2
|
10
|
3
|
|
North-Western Federal District
|
|
Arkhangelsk region
|
18
|
1
|
18
|
5
|
|
Vologda region
|
25
|
2
|
50
|
13
|
|
Kaliningrad region
|
8
|
4
|
32
|
8
|
|
Republic of Karelia
|
24
|
3
|
72
|
18
|
|
Komi Republic
|
15
|
1
|
15
|
4
|
|
Leningrad Region
|
30
|
1
|
30
|
8
|
|
Murmansk region
|
4
|
1
|
4
|
1
|
|
Nenets Autonomous Okrug
|
3
|
2
|
6
|
2
|
|
Novgorod region
|
14
|
3
|
42
|
11
|
|
Pskov region
|
10
|
3
|
30
|
8
|
|
Saint-Petersburg
|
23
|
1
|
23
|
6
|
|
Southern Federal District
|
|
Republic of Adygea
|
10
|
4
|
40
|
10
|
|
Astrakhan region
|
6
|
2
|
12
|
3
|
|
Volgograd region
|
7
|
3
|
21
|
5
|
|
Republic of Kalmykia
|
5
|
1
|
5
|
1
|
|
Krasnodarskiy kray
|
7
|
2
|
14
|
4
|
|
Rostov region
|
8
|
3
|
24
|
6
|
|
Republic of Crimea
|
6
|
3
|
18
|
5
|
|
Sevastopol
|
6
|
4
|
24
|
6
|
|
North Caucasus Federal District
|
|
Republic of Dagestan
|
16
|
3
|
48
|
12
|
|
The Republic of Ingushetia
|
21
|
3
|
63
|
16
|
|
Kabardino-Balkarian Republic
|
30
|
4
|
120
|
30
|
|
Karachay-Cherkess Republic
|
38
|
3
|
114
|
29
|
|
The Republic of North Ossetia
|
18
|
2
|
36
|
9
|
|
Stavropol Territory
|
20
|
3
|
60
|
15
|
|
Chechen Republic
|
15
|
4
|
60
|
15
|
|
Volga Federal District
|
|
Republic of Bashkortostan
|
4
|
2
|
8
|
2
|
|
Kirov region
|
6
|
3
|
18
|
5
|
|
Republic of Mari El
|
6
|
3
|
18
|
5
|
|
Republic of Mordovia
|
3
|
2
|
6
|
2
|
|
Nizhny Novgorod region
|
5
|
2
|
10
|
3
|
|
Orenburg region
|
7
|
2
|
14
|
4
|
|
Penza region
|
3
|
2
|
6
|
2
|
|
Perm Region
|
6
|
2
|
12
|
3
|
|
Samara region
|
9
|
2
|
18
|
5
|
|
Saratov region
|
6
|
2
|
12
|
3
|
|
The Republic of Tatarstan
|
6
|
2
|
12
|
3
|
|
Udmurt Republic
|
3
|
1
|
3
|
1
|
|
Ulyanovsk region
|
5
|
2
|
10
|
3
|
|
The Chuvash Republic
|
4
|
2
|
8
|
2
|
|
Ural Federal District
|
|
Kurgan region
|
5
|
3
|
15
|
4
|
|
Sverdlovsk region
|
10
|
1
|
10
|
3
|
|
Tyumen region
|
9
|
3
|
27
|
7
|
|
Khanty-Mansiysk Autonomous Okrug
|
8
|
1
|
8
|
2
|
|
Chelyabinsk region
|
7
|
1
|
7
|
2
|
|
Yamalo-Nenets Autonomous Okrug
|
8
|
1
|
8
|
2
|
|
Siberian Federal District
|
|
Altai Republic
|
22
|
3
|
66
|
17
|
|
Altai Territory
|
21
|
3
|
63
|
16
|
|
Irkutsk region
|
20
|
2
|
40
|
10
|
|
Kemerovo region
|
30
|
2
|
60
|
15
|
|
Krasnoyarsk Territory
|
10
|
2
|
20
|
5
|
|
Novosibirsk region
|
23
|
2
|
46
|
12
|
|
Omsk region
|
11
|
3
|
33
|
8
|
|
Tomsk region
|
9
|
2
|
18
|
5
|
|
Republic of Tyva
|
8
|
4
|
32
|
8
|
|
Republic of Khakassia
|
10
|
1
|
10
|
3
|
|
Far Eastern Federal District
|
|
Amur region
|
16
|
3
|
48
|
12
|
|
The Republic of Buryatia
|
33
|
2
|
66
|
17
|
|
The Jewish Autonomous Region
|
4
|
3
|
12
|
3
|
|
Trans-Baikal Territory
|
17
|
3
|
51
|
13
|
|
Kamchatka Territory
|
18
|
3
|
54
|
14
|
|
Magadan region
|
7
|
1
|
7
|
2
|
|
Primorsky Krai
|
8
|
2
|
16
|
4
|
|
The Republic of Sakha (Yakutia)
|
12
|
1
|
12
|
3
|
|
Sakhalin region
|
26
|
2
|
52
|
13
|
|
Khabarovsk Territory
|
9
|
2
|
18
|
5
|
|
Chukotka Autonomous Okrug
|
5
|
1
|
5
|
1
|
Source: compiled by the authors on the basis of data from the Federal Treasury of the Russian Federation: https://roskazna.gov.ru/ispolnenie-byudzhetov/konsolidirovannye-byudzhety-subektov/974 /
To assess the dynamics of socio-economic indicators, it was decided to use data from the Federal State Statistics Service (Rosstat). For the analysis and subsequent scaling of the regions, data were collected on the dynamics of GRP per capita, on the dynamics of the unemployment rate, as well as on the dynamics of the consumer price index in the regions. For each indicator, a rank scale was used, followed by conversion to a scoring scale in the range from 0 to 10, where a value of 0 marks the regions most affected from the point of view of the analyzed indicators, and a value of 10 marks the least affected regions. When ranking regions by indicators, if their indicators were identical (rounded to hundredths), the regions occupied an identical place in the ranking.
The "GRP per capita" column represents the ratio of the difference between GRP per capita for 2021 and GRP per capita for 2020 to GRP per capita for 2021 as a percentage. The unemployment column reflects the dynamics of the number of unemployed aged 15 and over as a percentage of the unemployment rate in 2020 compared to 2021. The "Inflation rate" column reflects the difference between the consumer price index in the region for 2021 and the same index for 2020. This column is intended to show the dynamics of inflation rates in the regions. The calculations were carried out by the authors independently on the basis of the data presented in the statistical collection "Regions of Russia. Socio-economic indicators. 2022."
The total assessment of the impact on the dynamics of socio-economic indicators of the regions during the COVID-19 crisis is a combination of estimates of all three indicators. Thus, the assessment of the dynamics of socio-economic indicators is a scale with a rating score of up to 30 points. A table with data on the above scale is presented below (Table 3).
Table 3. Assessment of the dynamics of socio-economic indicators of the regions during the COVID-19 crisis.
|
The subject of the Federation
|
GRP per capita
|
Evaluation
|
Unemployment
|
Evaluation
|
The rate of inflation
|
Evaluation
|
Amounts. Evaluation
|
|
The Central Federal District
|
|
Belgorod region
|
-0,26
|
3
|
-0,7
|
3
|
4,2
|
2
|
8
|
|
Bryansk region
|
-0,12
|
7
|
-0,6
|
2
|
4,1
|
2
|
11
|
|
Vladimir region
|
-0,25
|
4
|
-1,7
|
6
|
3,6
|
4
|
14
|
|
Voronezh Region
|
7,5
|
10
|
-0,5
|
2
|
2,4
|
7
|
19
|
|
Ivanovo region
|
-0,1
|
8
|
-0,9
|
3
|
4,1
|
2
|
13
|
|
Kaluga Region
|
-0,15
|
6
|
-0,7
|
3
|
3,2
|
5
|
14
|
|
Kostroma region
|
-0,15
|
6
|
-1,1
|
4
|
3,3
|
5
|
15
|
|
Kursk region
|
-0,23
|
4
|
-0,9
|
3
|
4
|
3
|
10
|
|
Lipetsk region
|
-0,27
|
3
|
-0,1
|
1
|
3
|
5
|
9
|
|
Moscow
|
-0,17
|
6
|
0
|
0
|
3,3
|
5
|
11
|
|
Moscow oblast
|
-0,2
|
5
|
-0,2
|
1
|
5,1
|
0
|
6
|
|
Oryol region
|
-0,16
|
6
|
-1,4
|
5
|
3,9
|
3
|
14
|
|
Ryazan region
|
-0,13
|
7
|
-1,4
|
5
|
3,2
|
5
|
17
|
|
Smolensk region
|
-0,13
|
7
|
-0,3
|
1
|
2,7
|
6
|
14
|
|
Tambov region
|
-0,12
|
7
|
-0,7
|
3
|
4,2
|
2
|
12
|
|
Tver region
|
-0,12
|
7
|
-0,5
|
2
|
3,9
|
3
|
12
|
|
Tula region
|
-0,18
|
6
|
-0,6
|
2
|
2,6
|
6
|
14
|
|
Yaroslavl region
|
-0,11
|
7
|
-1,4
|
5
|
3,8
|
3
|
15
|
|
North-Western Federal District
|
|
Arkhangelsk region
|
-0,26
|
3
|
-0,7
|
3
|
4,9
|
1
|
7
|
|
Vologda region
|
-0,38
|
1
|
-1,4
|
5
|
4
|
3
|
9
|
|
Kaliningrad region
|
-0,19
|
5
|
-0,9
|
3
|
4,4
|
2
|
10
|
|
Republic of Karelia
|
-0,92
|
0
|
-2,1
|
7
|
3,3
|
5
|
12
|
|
Komi Republic
|
-0,28
|
3
|
-0,7
|
3
|
0,9
|
9
|
15
|
|
Leningrad Region
|
-0,16
|
6
|
-1,6
|
6
|
3,9
|
3
|
15
|
|
Murmansk region
|
-0,26
|
3
|
-1,9
|
7
|
3,1
|
5
|
15
|
|
Nenets Autonomous Okrug
|
-0,43
|
0
|
-0,3
|
1
|
0,3
|
10
|
11
|
|
Novgorod region
|
-0,18
|
6
|
-1,7
|
6
|
1,8
|
8
|
20
|
|
Pskov region
|
-0,08
|
9
|
-1,8
|
6
|
3,2
|
5
|
20
|
|
Saint-Petersburg
|
-0,43
|
0
|
-0,9
|
3
|
4
|
3
|
6
|
|
Southern Federal District
|
|
Republic of Adygea
|
-0,16
|
6
|
-0,3
|
1
|
3,1
|
5
|
12
|
|
Astrakhan region
|
-0,19
|
5
|
-0,2
|
1
|
3,6
|
4
|
10
|
|
Volgograd region
|
-0,07
|
9
|
-2,7
|
9
|
2,9
|
6
|
24
|
|
Republic of Kalmykia
|
-0,06
|
9
|
-0,6
|
2
|
5,2
|
0
|
11
|
|
Krasnodarskiy kray
|
-0,16
|
6
|
-0,7
|
3
|
4,2
|
2
|
11
|
|
Rostov region
|
-0,15
|
6
|
-1
|
4
|
3,4
|
4
|
14
|
|
Republic of Crimea
|
-0,12
|
7
|
-0,5
|
2
|
3,5
|
4
|
13
|
|
Sevastopol
|
-0,15
|
6
|
-0,4
|
2
|
4,4
|
2
|
10
|
|
North Caucasus Federal District
|
|
Republic of Dagestan
|
-0,09
|
8
|
-0,6
|
2
|
4,5
|
1
|
11
|
|
The Republic of Ingushetia
|
-0,08
|
9
|
1,1
|
0
|
3,1
|
5
|
14
|
|
Kabardino-Balkarian Republic
|
-0,09
|
8
|
-3,1
|
9
|
2,8
|
6
|
23
|
|
Karachay-Cherkess Republic
|
-0,12
|
7
|
-2,4
|
8
|
2,3
|
7
|
22
|
|
The Republic of North Ossetia
|
-0,15
|
6
|
-2
|
7
|
4,1
|
2
|
15
|
|
Stavropol Territory
|
-0,17
|
6
|
-0,9
|
3
|
3,3
|
5
|
14
|
|
Chechen Republic
|
-0,06
|
9
|
-4
|
10
|
2,6
|
6
|
25
|
|
Volga Federal District
|
|
Republic of Bashkortostan
|
-0,15
|
6
|
-1,6
|
6
|
3,7
|
4
|
16
|
|
Kirov region
|
-0,17
|
6
|
-0,5
|
2
|
3,9
|
3
|
11
|
|
Republic of Mari El
|
-0,1
|
8
|
-1,5
|
5
|
2,7
|
6
|
19
|
|
Republic of Mordovia
|
-0,1
|
8
|
-1,1
|
4
|
3,3
|
5
|
17
|
|
Nizhny Novgorod region
|
-0,15
|
6
|
-0,4
|
2
|
2,3
|
7
|
15
|
|
Orenburg region
|
-0,25
|
4
|
-1,2
|
5
|
3,8
|
3
|
12
|
|
Penza region
|
-0,09
|
8
|
-0,8
|
3
|
2,2
|
7
|
18
|
|
Perm Region
|
-0,2
|
5
|
-1,1
|
4
|
4,4
|
2
|
11
|
|
Samara region
|
-0,23
|
4
|
-0,9
|
3
|
3,2
|
5
|
12
|
|
Saratov region
|
-0,15
|
6
|
-1,1
|
4
|
2
|
8
|
18
|
|
The Republic of Tatarstan
|
-0,23
|
4
|
-1
|
4
|
3,9
|
3
|
11
|
|
Udmurt Republic
|
-0,18
|
6
|
-1,8
|
6
|
3,5
|
4
|
16
|
|
Ulyanovsk region
|
-0,12
|
7
|
-0,6
|
2
|
3,1
|
5
|
14
|
|
The Chuvash Republic
|
-0,12
|
7
|
-1,3
|
5
|
3,7
|
3
|
15
|
|
Ural Federal District
|
|
Kurgan region
|
-0,1
|
8
|
-0,6
|
2
|
3,1
|
5
|
15
|
|
Sverdlovsk region
|
-0,17
|
6
|
-1,7
|
6
|
3,9
|
3
|
15
|
|
Tyumen region
|
-0,35
|
2
|
-0,4
|
2
|
2,6
|
6
|
10
|
|
Khanty-Mansiysk Autonomous Okrug
|
-0,4
|
1
|
-0,4
|
2
|
1,6
|
9
|
12
|
|
Chelyabinsk region
|
-0,21
|
5
|
-1,9
|
7
|
2,1
|
8
|
20
|
|
Yamalo-Nenets Autonomous Okrug
|
-0,33
|
2
|
-0,3
|
1
|
3,1
|
5
|
8
|
|
Siberian Federal District
|
|
Altai Republic
|
-0,11
|
7
|
-2
|
7
|
4,1
|
2
|
16
|
|
Altai Territory
|
-0,21
|
5
|
-0,4
|
2
|
4,8
|
1
|
8
|
|
Irkutsk region
|
-0,22
|
4
|
-1,7
|
6
|
3,8
|
3
|
13
|
|
Kemerovo region
|
-0,42
|
1
|
-1,3
|
5
|
4,6
|
1
|
7
|
|
Krasnoyarsk Territory
|
-0,11
|
7
|
-2,4
|
8
|
4,3
|
2
|
17
|
|
Novosibirsk region
|
-0,16
|
6
|
-0,6
|
2
|
4,8
|
1
|
9
|
|
Omsk region
|
-0.09
|
8
|
-2,4
|
8
|
4,5
|
1
|
17
|
|
Tomsk region
|
-0,22
|
4
|
-1,8
|
6
|
3,2
|
5
|
15
|
|
Republic of Tyva
|
-0,07
|
9
|
-3
|
9
|
2,7
|
6
|
24
|
|
Republic of Khakassia
|
-0,13
|
7
|
-2,3
|
8
|
4,2
|
2
|
17
|
|
Far Eastern Federal District
|
|
Amur region
|
-0,15
|
6
|
-0,8
|
3
|
-0,9
|
10
|
19
|
|
The Republic of Buryatia
|
-0,11
|
7
|
-1
|
4
|
3,4
|
4
|
15
|
|
The Jewish Autonomous Region
|
-0,2
|
5
|
-0,7
|
3
|
2,4
|
7
|
15
|
|
Trans-Baikal Territory
|
-0,13
|
7
|
-0,5
|
2
|
4,1
|
2
|
11
|
|
Kamchatka Territory
|
-0,12
|
7
|
-0,3
|
1
|
3,4
|
4
|
12
|
|
Magadan region
|
-0,09
|
8
|
-0,7
|
3
|
3,6
|
4
|
15
|
|
Primorsky Krai
|
-0,15
|
6
|
-1,3
|
5
|
2,4
|
7
|
18
|
|
The Republic of Sakha (Yakutia)
|
-0,3
|
2
|
-0,5
|
2
|
2,2
|
7
|
11
|
|
Sakhalin region
|
-0,19
|
5
|
-0,3
|
1
|
1,2
|
9
|
15
|
|
Khabarovsk Territory
|
-0,13
|
7
|
-0,9
|
3
|
1,3
|
9
|
19
|
|
Chukotka Autonomous Okrug
|
-0,2
|
5
|
-1,8
|
6
|
3,9
|
3
|
14
|
Source: compiled by the authors on the basis of the Collection ROSSTAT "Regions of Russia. Socio-economic indicators. 2022."
Let's imagine the indicator of the scale of assessment of the intensity of anti-crisis industrial policy with the value along the abscissa axis, and the indicator of the scale of the impact of the crisis on socio-economic indicators with the value along the ordinate axis. As a result, a graph was built, diagrams of the dispersion of regions according to the specified variables. (Figure 1.)
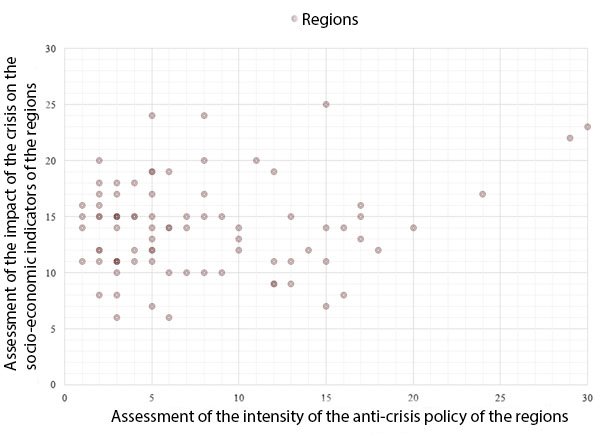
Figure 1. Dispersion diagram of the assessment of the intensity of anti-crisis industrial policy and the impact of the crisis on the socio-economic indicators of the region.
Source: compiled by the authors on the basis of Table 2 and Table 3.
For greater clarity, we will introduce a separate designation for the regions of each federal district. In this case, the graph will be transformed as follows (Figure 2.).
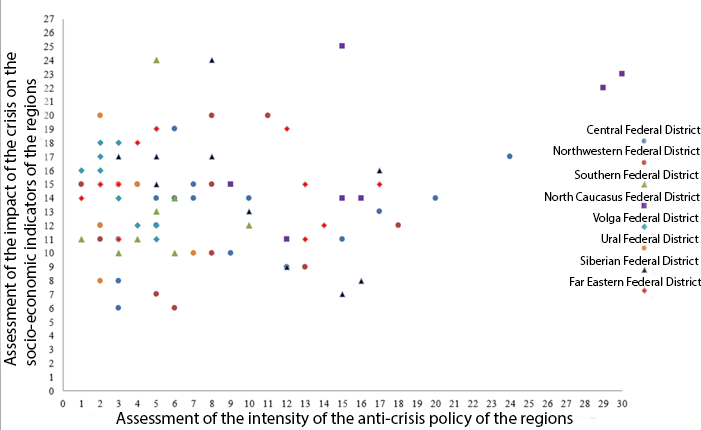
Figure 2. The dispersion diagram of the assessment of the intensity of anti-crisis industrial policy and the impact of the crisis on the socio-economic indicators of the federal districts of the Russian Federation.
Source: compiled by the authors on the basis of Table 2 and Table 3.
The most obvious option for interpreting the data obtained may be a correlation analysis – a search for the interdependence of the intensity of the anti-crisis industrial policy pursued by the regions and the crisis dynamics of socio-economic indicators. The correlation was searched using the following formula, where  and and  are the average values of the arrays: are the average values of the arrays:

The value of the correlation coefficient for this data series was 0.165, which does not allow us to talk about the presence of a significant correlation. Thus, we cannot confirm the existence of significant links between the indicators of the intensity of industrial anti-crisis industrial policy and the dynamics of socio-economic indicators of the regions of the Russian Federation.
Based on the results obtained, the authors decided to classify and cluster regions by assessing the impact of the crisis on the socio-economic development of the region and assessing the intensity of anti-crisis policy measures.
Clustering was carried out using the Ward method and the square of the Euclidean distance. Before clustering, the authors standardized the data of indicators for assessing the impact of the crisis on the socio-economic development of the region and assessing the intensity of anti-crisis policy measures.
Cluster analysis showed four main clusters (Figure 3 and Table 4):
(1) regions that practically did not implement an anti-crisis industrial policy and suffered during the crisis;
(2) regions with significant economic stability and rather than resorting to an active anti-crisis policy;
(3) regions, the values of indicators of the dynamics of socio-economic indicators of which are on average and below the level, but on average more intensive anti-crisis policy;
(4) regions that have pursued an active anti-crisis industrial policy and have achieved good socio-economic indicators.
Figure 3. Clustering of regions to assess the intensity of anti-crisis industrial policy and the impact of the crisis on the socio-economic indicators of the regions.
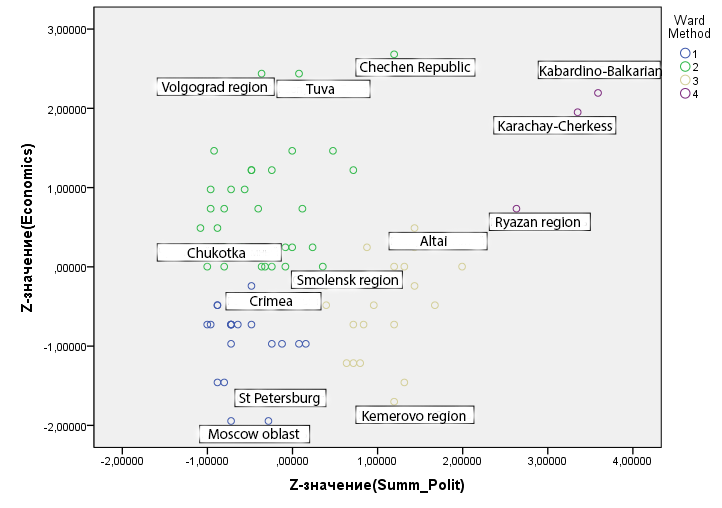
Source: compiled by the authors on the basis of Table 2 and Table 3.
Table 4. Affiliation of regions to clusters.
|
|
Belonging to a cluster
|
Total
|
|
1
|
2
|
3
|
4
|
|
Regions
|
Arkhangelsk region
|
1
|
0
|
0
|
0
|
1
|
|
Astrakhan region
|
1
|
0
|
0
|
0
|
1
|
|
Belgorod region
|
1
|
0
|
0
|
0
|
1
|
|
Bryansk region
|
1
|
0
|
0
|
0
|
1
|
|
Kaliningrad region
|
1
|
0
|
0
|
0
|
1
|
|
Kirov region
|
1
|
0
|
0
|
0
|
1
|
|
Krasnodarskiy kray
|
1
|
0
|
0
|
0
|
1
|
|
Kursk region
|
1
|
0
|
0
|
0
|
1
|
|
Moscow oblast
|
1
|
0
|
0
|
0
|
1
|
|
Nenets Autonomous Okrug
|
1
|
0
|
0
|
0
|
1
|
|
Orenburg region
|
1
|
0
|
0
|
0
|
1
|
|
Perm Region
|
1
|
0
|
0
|
0
|
1
|
|
Republic of Kalmykia
|
1
|
0
|
0
|
0
|
1
|
|
Republic of Crimea
|
1
|
0
|
0
|
0
|
1
|
|
The Republic of Sakha (Yakutia)
|
1
|
0
|
0
|
0
|
1
|
|
The Republic of Tatarstan
|
1
|
0
|
0
|
0
|
1
|
|
Samara region
|
1
|
0
|
0
|
0
|
1
|
|
Saint-Petersburg
|
1
|
0
|
0
|
0
|
1
|
|
Sevastopol
|
1
|
0
|
0
|
0
|
1
|
|
Tambov region
|
1
|
0
|
0
|
0
|
1
|
|
Tver region
|
1
|
0
|
0
|
0
|
1
|
|
Tyumen region
|
1
|
0
|
0
|
0
|
1
|
|
Khanty-Mansiysk Autonomous Okrug
|
1
|
0
|
0
|
0
|
1
|
|
Yamalo-Nenets Autonomous Okrug
|
1
|
0
|
0
|
0
|
1
|
|
Amur region
|
0
|
1
|
0
|
0
|
1
|
|
Vladimir region
|
0
|
1
|
0
|
0
|
1
|
|
Volgograd region
|
0
|
1
|
0
|
0
|
1
|
|
Voronezh Region
|
0
|
1
|
0
|
0
|
1
|
|
The Jewish Autonomous Region
|
0
|
1
|
0
|
0
|
1
|
|
Kaluga Region
|
0
|
1
|
0
|
0
|
1
|
|
Kostroma region
|
0
|
1
|
0
|
0
|
1
|
|
Krasnoyarsk Territory
|
0
|
1
|
0
|
0
|
1
|
|
Kurgan region
|
0
|
1
|
0
|
0
|
1
|
|
Leningrad Region
|
0
|
1
|
0
|
0
|
1
|
|
Magadan region
|
0
|
1
|
0
|
0
|
1
|
|
Murmansk region
|
0
|
1
|
0
|
0
|
1
|
|
Nizhny Novgorod region
|
0
|
1
|
0
|
0
|
1
|
|
Novgorod region
|
0
|
1
|
0
|
0
|
1
|
|
Omsk region
|
0
|
1
|
0
|
0
|
1
|
|
Oryol region
|
0
|
1
|
0
|
0
|
1
|
|
Penza region
|
0
|
1
|
0
|
0
|
1
|
|
Primorsky Krai
|
0
|
1
|
0
|
0
|
1
|
|
Pskov region
|
0
|
1
|
0
|
0
|
1
|
|
Republic of Bashkortostan
|
0
|
1
|
0
|
0
|
1
|
|
Komi Republic
|
0
|
1
|
0
|
0
|
1
|
|
Republic of Mari El
|
0
|
1
|
0
|
0
|
1
|
|
Republic of Mordovia
|
0
|
1
|
0
|
0
|
1
|
|
The Republic of the North
|
0
|
1
|
0
|
0
|
1
|
|
Republic of Tyva
|
0
|
1
|
0
|
0
|
1
|
|
Republic of Khakassia
|
0
|
1
|
0
|
0
|
1
|
|
Rostov region
|
0
|
1
|
0
|
0
|
1
|
|
Saratov region
|
0
|
1
|
0
|
0
|
1
|
|
Sverdlovsk region
|
0
|
1
|
0
|
0
|
1
|
|
Smolensk region
|
0
|
1
|
0
|
0
|
1
|
|
Tomsk region
|
0
|
1
|
0
|
0
|
1
|
|
Udmurt Republic
|
0
|
1
|
0
|
0
|
1
|
|
Ulyanovsk region
|
0
|
1
|
0
|
0
|
1
|
|
Khabarovsk Territory
|
0
|
1
|
0
|
0
|
1
|
|
Chelyabinsk region
|
0
|
1
|
0
|
0
|
1
|
|
Chechen Republic
|
0
|
1
|
0
|
0
|
1
|
|
The Chuvash Republic
|
0
|
1
|
0
|
0
|
1
|
|
Chukotka Autonomous Region
|
0
|
1
|
0
|
0
|
1
|
|
Yaroslavl region
|
0
|
1
|
0
|
0
|
1
|
|
Altai Territory
|
0
|
0
|
1
|
0
|
1
|
|
Vologda region
|
0
|
0
|
1
|
0
|
1
|
|
Trans-Baikal Territory
|
0
|
0
|
1
|
0
|
1
|
|
Ivanovo region
|
0
|
0
|
1
|
0
|
1
|
|
Irkutsk region
|
0
|
0
|
1
|
0
|
1
|
|
Kamchatka Territory
|
0
|
0
|
1
|
0
|
1
|
|
Kemerovo region
|
0
|
0
|
1
|
0
|
1
|
|
Lipetsk region
|
0
|
0
|
1
|
0
|
1
|
|
Moscow
|
0
|
0
|
1
|
0
|
1
|
|
Novosibirsk region
|
0
|
0
|
1
|
0
|
1
|
|
Republic of Adygea
|
0
|
0
|
1
|
0
|
1
|
|
Altai Republic
|
0
|
0
|
1
|
0
|
1
|
|
The Republic of Buryatia
|
0
|
0
|
1
|
0
|
1
|
|
Republic of Dagestan
|
0
|
0
|
1
|
0
|
1
|
|
The Republic of Ingushetia
|
0
|
0
|
1
|
0
|
1
|
|
Republic of Karelia
|
0
|
0
|
1
|
0
|
1
|
|
Sakhalin region
|
0
|
0
|
1
|
0
|
1
|
|
Stavropol Territory
|
0
|
0
|
1
|
0
|
1
|
|
Tula region
|
0
|
0
|
1
|
0
|
1
|
|
Kabardino-Balkarian Republic
|
0
|
0
|
0
|
1
|
1
|
|
Karachay-Cherkess Republic
|
0
|
0
|
0
|
1
|
1
|
|
Ryazan region
|
0
|
0
|
0
|
1
|
1
|
|
Total
|
24
|
39
|
19
|
3
|
85
|
Source: compiled by the authors on the basis of Table 2 and Table 3.
There was no strict relationship between the region's affiliation to the federal district and its cluster. Nevertheless, we can note that almost all regions of the Volga Federal District are in cluster 2, and the Ural and Southern Federal Districts are on the border of clusters 2 and 1. Cluster 3 is mainly represented by the regions of the Far Eastern and Siberian and federal districts. And the small cluster 4 consists of the Ryazan Region (Central Federal District), as well as the Kabardino-Balkarian and Karachay-Cherkess Republics (North Caucasus Federal District). The relatively high performance of the last two regions is a consequence of active budget expenditures and relative resistance to economic crises due to their sectoral industrial specialization.
Before proceeding to the conclusion, we will highlight the leading regions and outsider regions in terms of anti-crisis industrial policy measures for each cluster (Table 5).
Table 5. Leading regions and outsider regions in terms of the effectiveness of anti-crisis industrial policy.
|
|
Cluster (1)
|
Cluster (2)
|
Cluster (3)
|
Cluster (4)
|
|
Leading regions
|
Republic of Crimea
|
Chechen Republic
|
Altai Republic
|
Kabardino-Balkarian Republic, Karachay-Cherkess Republic
|
|
Outsider regions
|
Moscow region, St. Petersburg
|
Smolensk Region, Chukotka Autonomous Okrug
|
Kemerovo region
|
Ryazan region
|
Source: compiled by the authors on the basis of Table 2, Table 3 and Table 4.
conclusion
A comparative analysis of the regional anti-crisis industrial policy of the subjects of the Russian Federation was presented within the framework of five factors divided into two scales. The first scale measured the intensity of anti-crisis industrial policy and used the number of anti-crisis industrial policy measures, as well as the scale of anti-crisis policy measures. In controversial cases, attention was drawn to the variety of anti-crisis industrial policy measures in the region. The second scale measured the impact of the crisis on the socio-economic indicators of the regions and used for this the dynamics of GRP per capita, the dynamics of the number of unemployed aged 15 and older, as well as the dynamics of inflation growth rates. Based on the results of such scaling, each region received two scores on a 30-point scale, which formed a series of data for correlation and cluster analysis.
No correlation was detected during the correlation analysis. This result is particularly interesting. It can mean one of two things: either mistakes were made in the calculations of the scales, or the regional anti-crisis industrial policy of Russia in the analyzed period of time is not related to the volume of financing. This opens up a wide scope for further research, since such a result requires additional verification. In order to consider the bold conclusion voiced fully proven, it seems reasonable to significantly expand the number of analyzed socio-economic indicators in future studies. Also, a possible option for improving the methodology for assessing the intensity of the anti-crisis industrial policy of the regions of the Russian Federation is the inclusion of a parameter for the effectiveness of the management of regional governments (the quality of political institutions and the quality of management).
For a more visual cluster analysis, a regional dispersion diagram was constructed with the parameters of the scales for assessing the intensity of anti-crisis industrial policy and the result of scaling the impact of the crisis on the socio-economic indicators of the region. Four clusters were identified:
(1) regions that practically did not implement an anti-crisis industrial policy and suffered during the crisis;
(2) regions with significant economic stability and rather than resorting to an active anti-crisis policy;
(3) regions, the values of indicators of the dynamics of socio-economic indicators of which are on average and below the level, but on average more intensive anti-crisis policy;
(4) regions that have pursued an active anti-crisis industrial policy and have achieved good socio-economic indicators.
There was no obvious connection between the region's affiliation to the federal district and the cluster. However, it was noted that a significant part of the regions of the Volga Federal District are in cluster 2, and the Ural and Southern Federal Districts are on the border of clusters 2 and 1. Cluster 3 was mainly represented by the regions of the Far Eastern and Siberian and federal districts
Based on the clustering of regions, the leading regions and outsider regions were identified for each cluster, based on an assessment of the dynamics of the impact of the crisis on the socio-economic indicators of the regions.
A summary table of the frequency of use of various types of anti-crisis industrial policy measures was also compiled. It seems appropriate to recall that the classification itself is author's and needs some kind of refinement. Thus, it was noted that there is an excessive differentiation of the types of measures by frequency of use. This indicates the need to improve the classification of anti-crisis industrial policy measures. Some types need to be detailed, and some need to be considered for integration with other types. It also seems appropriate to note that differentiation by individual types may not be caused by classification problems, but may be a consequence of a similar geographical location (especially relevant for the regions of the Far Eastern Federal District) or certain managerial traditions within the framework of the presidential plenipotentiaries in charge of the federal districts.
Thus, we can conclude with the prospects for further research, which will undoubtedly be continued. It is necessary to expand the number of analyzed socio-economic indicators and include data for 2022 in the analysis, analyze the possibility of vulnerability sustainability factors in leading and outsider regions, improve the very classification of anti-crisis industrial policy measures and re-conduct correlation and cluster analysis. In this case, based on the results obtained, it will be possible to speak with a certain degree of confidence about the effectiveness of a separate regional anti-crisis industrial policy, as well as about the effectiveness of individual anti-crisis industrial policy measures in the regional plane.
References
1. Koshkin, A., Rakhman Khashimi, M., Sharagina, A. et al. (2021). “Return to a Sustainable Economy Classification of Anti-Crisis Industrial Policy Measures of States in a Market Economy“, 273-278. Silin, Y. (eds.). Proceedings of the Second Conference on Sustainable Development: Industrial Future of Territories, Atlantis Press, Ekaterinburg.
2. Koshkin, A. V., Koltsova, A. A., Pashkus, N. A. et al. (2022). “Regional Tax Incentives as an Option for Implementing Anti-Crisis Industrial Policy: On the Example of Russian Regional Tax Policy During the COVID-19 Pandemic”, in Kliestik, T. (eds.). Proceedings of the 22th International Scientific Conference Globalization and Its Socio-Economic consequences, University of Zilina, Zilina, 714-724.
3. Koshkin, A., & Andreeva, D. (2021). Conceptualization of industrial policy: formation of priority areas of development or creation of conditions for growth? Marketing MBA. Marketing management of the enterprise, 4(12), 58-68.
4. Koshkin, A. V. (2021). The economic aspect of Russian federalism: inter-budget transfers during the beginning of the COVID-19 pandemic. Marketing MBA. Marketing management of the enterprise, 1(12), 69-81.
5. Koshkin, A., Rakhman Khashimi, M., Sharagina, A. et al. (2022). Anti-Crisis Industrial Policy Of The Russian Regions During The Covid-19 Pandemic. European Proceedings of Social and Behavioural Sciences, 54(128), 386-397. Retrieved from https://doi.org/10.15405/epsbs.2022.11.54
6. Rybakov, F. F. (2013). Industrial policy of Russia: controversial issues. Bulletin of St. Petersburg University, Economy, 1, 33-38.
7. Rodrick, D.(2004). Industrial Policy for the Twenty-First Century [DX Reader version]. Retrieved from https://drodrik.scholar.harvard.edu/files/dani-rodrik/files/industrial-policy-twenty-first-century.pdf
8. Rodrik, D. (2010). Diagnostics before Prescription. Journal of Economic Perspectives, 3(24), 33-44.
9. Rodrik, D. (2008). Normalizing Industrial Policy. The World Bank, Washington, Commission on Growth and Development Working Paper, 3. Retrieved from http://documents.worldbank.org
10. Rodrik, D. (2018). Straight Talk on Trade: Ideas for a Sane World Economy. Princeton, US: Princeton University Press.
11. Aliaskarova, Zh. A., Asadulaev, A. B., Pashkus, V. Yu. (2020). Industrial policy: conceptualization and modernization in the conditions of crisis, Problems of modern economy, 2, 73-77.
12. Chebotarev, N. F. (2016). State anti-crisis regulation and challenges of the new reality, Prospect.
13. Lysenko, E. A., & Mechikova, M. N. (2020). Anti-Crisis Policy of States in the Context of Overcoming Socio-Economic Consequences COVID-19. Herald of Siberian Institute of Business and Information Technologies, 3, 83-89.
14. Starikov, E. N. (2017). Industrial policy: approaches to the formation and management of implementation: monograph [DX Reader version]. Retrieved from https://core.ac.uk/download/pdf/84828954.pdf
15. Okuno-Fujiwara, M., & Suzumura, K. (1994). “Economic Analysis of Industrial Policy: A Conceptual Framework through the Japanese Experience”, Asahi, Tokyo.
16. Otis, L., & Graham, Jr. (1994). Losing Time: The Industrial Policy Debate, Harvard University Press, Cambridge, USA.
17. Rybakov, F. F. (2011). Industrial Policy of Russia: History and modernity. St. Petersburg, Russia: Nauka.
18. Aliaskarova, Zh. A., Pashkus, V. Yu., & Blagikh, I.A. (2020). Proactive Industrial Policy as the Main Strategy for Improving Russia's Competitiveness in the Context of Global Economic Processes. SHS Web of Conferences, 06002(74), 1-9.
19. Foreman-Peck, J., & Frederico, G. (1999). European Industrial Policy: The TwentiethCentury Experience, Oxford University Press, Oxford.
20. Tatarkin, A. I., & Romanova, O. A. (2014). Industrial policy: genesis, regional features and legislative support. The economy of the region, 2, 9-21.
21. Kondratiev, N. D., & Yakovets, Yu. V.(2002). Large cycles of conjuncture and the theory of foresight. Moscow, Russia: Ekonomika.
22. Danilova, I. V., Mikhailova, I. P., & Nesytyh, K. Yu. (2022). Evolution of the Goals and Instruments of the EU Regional Industrial Policy: Benchmarks for Russia. Bulletin of the South Ural State University. Ser. Economics and Management, 1(16), 7-17. doi:10.14529/em220101
23. Koshkin, A. V. (2022). On the issue of classification of regional anti-crisis industrial policy in Russia. Proceedings of the Aktual'nyye problemy sovremennoy ekonomiki: novaya real'nost': sbornik nauchnykh rabot molodykh issledovateley. Pp. 142-146. St. Petersburg: OOO "NITS ART".
First Peer Review
Peer reviewers' evaluations remain confidential and are not disclosed to the public. Only external reviews, authorized for publication by the article's author(s), are made public. Typically, these final reviews are conducted after the manuscript's revision. Adhering to our double-blind review policy, the reviewer's identity is kept confidential.
The list of publisher reviewers can be found here.
The subject of the study. Based on the title, the article should be devoted to the anti-crisis industrial policy of the subjects of the Russian Federation during the COVID-19 pandemic. The content of the article, in general, corresponds to the stated topic, but most of the judgments require clarification, including in terms of synchronization with the title of the article. The research methodology is based on the use of data analysis and synthesis methods, their graphical representation (in the form of tables and figures). Of particular interest is the dispersion diagram of the assessment of the intensity of anti-crisis industrial policy and the impact of the crisis on the socio-economic indicators of the region (shown in Figure 1). The author also identified "leading regions" and "outsider regions" in the course of the study, but the methodology for classifying the subjects of the Russian Federation into these groups was not clear: it is recommended to provide appropriate explanations in the section "Methodology and methods" formed by the author. Under all graphical objects, it is necessary to specify the data source, including if author's calculations were made on the basis of them. The relevance of the research on the organization and implementation of anti-crisis industrial policy is beyond doubt, as this allows us to accumulate the necessary experience, as well as ensure the achievement of strategic development goals of the Russian Federation, including the national development goals of the Russian Federation for the period up to 2030. Scientific novelty is present in the material submitted for review. It is related, for example, to the author's classification of economic policy measures in the region. However, to what extent do these measures correspond to the anti-crisis industrial policy of the subjects of the Russian Federation stated in the title? (for example, how are payments to citizens related to the implementation of industrial policy? This connection is possible, but it must be shown in the text so that the reader does not have any questions) Style, structure, content. The style of presentation is scientific. The structure of the article was built by the author, which made it possible to methodically build the presentation competently. At the same time, improvements are required in terms of content. For example, the author claims that the Regions (1) of the cluster carried out an ultra-effective anti-crisis industrial policy: how did the author assess the effectiveness of the industrial policy? Based on the content of the text of the article, it seems possible to conclude that the scale of measures was estimated based on monetary valuation. Unfortunately, it was not possible to find specific numerical values in the text. The information given in table 2 does not allow us to conclude exactly how the assessment took place (the last column of the table): the situation is similar according to Table 3. What problems were identified by the author during the research and what does the author propose to solve them? Bibliography. The author has compiled a bibliographic list of 23 sources. It is valuable that not only foreign, but also domestic scientific publications have been studied. When finalizing the article, it is recommended to pay attention to the absence of publications in the bibliographic list of 2023. Appeal to opponents. Despite the bibliographic list formed, no scientific discussion was found in the text of the article. When finalizing the article, it is recommended to discuss the results obtained during the study with other scientists. Special attention should be paid to the answer to the question "What is the increase in scientific knowledge?" Conclusions, the interest of the readership. Taking into account all the above, the article requires revision, after which the issue of the expediency of publishing this scientific article can be resolved and re-reviewed. High-quality revision will ensure a high level of demand from the potential readership.
Second Peer Review
Peer reviewers' evaluations remain confidential and are not disclosed to the public. Only external reviews, authorized for publication by the article's author(s), are made public. Typically, these final reviews are conducted after the manuscript's revision. Adhering to our double-blind review policy, the reviewer's identity is kept confidential.
The list of publisher reviewers can be found here.
The reviewed article is devoted to the study of the anti-crisis industrial policy of the subjects of the Russian Federation during the COVID-19 pandemic. The research methodology is based on the generalization of published scientific papers on the subject of industrial policy, including its theoretical conceptualization. The authors attribute the relevance of the work to the fact that the COVID-19 pandemic has become one of the shocks to the global economy, and the analysis of significant empirical material within the framework of the theory of a separate type of anti-crisis industrial policy has a certain scientific value in terms of contribution to the verification of this theory. The scientific novelty of the reviewed study, according to the reviewer, consists in the results of clustering of regions and the allocation of leading regions and outsider regions for each cluster based on the assessment of the dynamics of the impact of the crisis on the socio-economic indicators of the regions. The following sections are structurally highlighted in the article: Introduction, Methodology and methods, Research results, Conclusion, Bibliography. The introduction substantiates the relevance of the topic, followed by a brief overview of the study of the problem in modern domestic and foreign literature. The authors propose to highlight the following measures of economic policy in the region: benefits for renting regional and municipal property; tax incentives; financial and consulting support for exporters; grants to social entrepreneurs; direct financial support for businesses; lump-sum payments to certain categories of citizens; long-term payments to social workers; industry subsidies; deferred payments for housing and communal services; increased purchases from small and medium-sized enterprises and entrepreneurs. In the process of studying regional anti-crisis policy measures, the general population of 85 regions of the Russian Federation was analyzed for the period from 02/01/2019 to 02/01/2022, a summary table of the frequency of use of types of anti-crisis industrial policy by federal districts was compiled; clustering was carried out, four clusters were identified: regions that practically did not carry out anti-crisis industrial policy and suffered during the crisis; regions with significant regions that have not resorted to an active anti-crisis policy; regions whose values of indicators of the dynamics of socio-economic indicators are average and below the level, but have on average pursued a more intensive anti-crisis policy; regions that have pursued an active anti-crisis industrial policy, and have achieved good socio-economic indicators. In each cluster, the leading regions and outsider regions are identified in terms of anti-crisis industrial policy measures. The bibliographic list includes 23 sources – publications of domestic and foreign scientists on the topic of the article, to which there are targeted links in the text confirming the existence of an appeal to opponents. Among the disadvantages, it should be noted the excessive bulkiness of the tables, which prevents the perception of the main author's idea, errors in the design of Figure 1 (for some reason its name is given not after, but before it), as well as some duplication of information in Figures 1 and 2, in connection with which the presence of Figure 1 looks superfluous in the publication. The article reflects the results of the research conducted by the authors, corresponds to the direction of the journal "Finance and Management", contains elements of scientific novelty and practical significance, may arouse interest among readers, and is recommended for publication.
|


