|
Software systems and computational methods
Reference:
Marchenko A., Shchemelinin D.
Development of an automated system for testing a cloud service for deploying virtual machines using modern monitoring tools
// Software systems and computational methods.
2023. ą 2.
P. 29-39.
DOI: 10.7256/2454-0714.2023.2.40755 EDN: TEVFBN URL: https://en.nbpublish.com/library_read_article.php?id=40755
Development of an automated system for testing a cloud service for deploying virtual machines using modern monitoring tools
Marchenko Andrei
ORCID: 0009-0001-9276-3907
Cloud Software Architect, Intel Corporation
193318, Russia, Saint Petersburg region, Saint Petersburg, Badaeva str., 6k1

|
mar4enko.ag@gmail.com
|
|
 |
|
Shchemelinin Dmitry
ORCID: 0000-0003-3032-130X
Doctor of Technical Science
Vice President, Intel Corporation
195251, Russia, Saint Petersburg, Politechnicheskaya str., 29
|
|
dshchmel@gmail.com
|
|
 |
|
DOI: 10.7256/2454-0714.2023.2.40755
EDN: TEVFBN
Received:
15-05-2023
Published:
04-08-2023
Abstract:
The object of this study is a service for managing virtual machines in a cloud environment. When developing and operating such a service, it becomes necessary to assess its availability and reliability for compliance with the selected quality level that the client can count on. This paper presents a developed system that allows testing the availability of a cloud service for managing virtual machines. The method of integration with the existing monitoring system at the enterprise using open source software in order to reduce the cost of development and operation is considered. A test case for deploying and removing a virtual machine using a graphical user interface has been developed and implemented, and triggering criteria have been defined. The requirements for the architecture and implementation of the system based on the production statistics of the virtual machine creation service using the Prometheus monitoring system are collected and analyzed. The novelty of the research lies in the development of a new method of testing a cloud service for managing virtual machines in order to increase its reliability and availability. Based on this method, a system for testing virtual machines is described and implemented, as well as a method for integration into the monitoring system of the Intel cloud service. During the operation of cloud environments with the help of this system, problem areas were identified in the architecture of the virtual machine creation service, which made it possible to optimize the system operation in a timely manner. The described method is an effective way to test cloud services, and can also be used to analyze and improve reliability and availability.
Keywords:
information technology, monitoring, prometheus, selenium, kubernetes, python, application testing, metrics, data processing, threshold
This article is automatically translated.
Introduction Cloud providers provide various types of services, such as hosting virtual machines, data storage, databases, analytics and much more. As a rule, access to these services is carried out both through the web interface and through the API (English Application Programming Interface) – a set of ready-made interfaces for software integration with services through various protocols. Monitoring the availability and performance of cloud systems and services is one of the most important aspects of ensuring their stable operation, and also allows you to identify and fix problems that arise during operation. Specialized software is used to monitor the availability of cloud services. One of the popular open source solutions is the Prometheus service [1]. This monitoring system allows you to collect and store data on performance and availability in the form of time series – a sequence of values that change over time. The collected data can then be analyzed using various methods, such as visualization, statistical analysis and machine learning.
In this study, a new method was proposed for testing and monitoring a cloud service that provides the user with the opportunity to rent virtual machines in the cloud, as well as choose one of the proposed types of virtual machine with a given amount of RAM, processors and storage. This type of service is very popular both for enterprises and for individual users and allows you to save significant resources by providing computing power on request. The object of scientific research The object of the study is Intel's internal cloud platform [2], which allows developers and researchers to use the resources of computing systems to test and optimize their applications and algorithms. The platform also provides extensive infrastructure management capabilities for computing, as well as efficient resource management and is used to perform various tasks such as big data processing and machine learning. Intel is one of the world's leading manufacturers of electronic devices and computer components: microprocessors and system logic sets (chipsets) for client computing systems and data centers, chips for artificial intelligence systems and the Internet of Things, non-volatile memory.
One of the key services of the cloud platform is VMaaS (English Virtual Machine as a Service), which provides a virtual infrastructure. Having studied the statistics of virtual machine reservations in the internal cloud (Figure 1), we can conclude that the demand for virtual infrastructure is constantly growing, and consequently, the requirements for stability and reliability of the service are increasing. 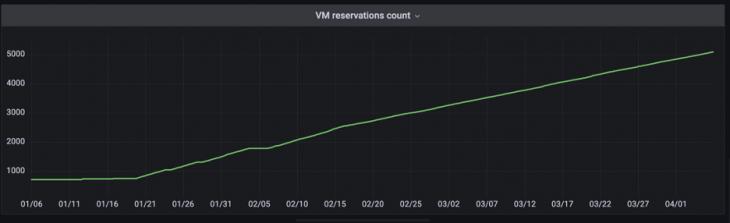
Figure 1. The number of virtual machine reservations in the VMaaS system from 06.01.2023 to 01.04.2023 The purpose of the study The subject of this study is the development of a method and system for testing the availability of a virtual machine deployment service in the cloud based on Prometheus and Selenium [3], characterized by the following scientific novelty: - Implementation of the Virtual Machine deployment testing service in the cloud
- Integration of Prometheus and Selenium tools with the deployment service and definition of scenarios for monitoring and testing cloud resources
- A new method for collecting and analyzing availability data using Prometheus and Selenium, including identifying performance issues and optimizing the operation of the virtual machine deployment service in the cloud
Research Methods The main functional requirement for the testing subsystem is the ability to create and delete a virtual machine with the specified characteristics – memory, processor, disk space. The user interface was selected to interact with the system. This allowed not only to ensure maximum compliance of the test scenario with the behavior of the end user in the system, but also to organize the collection of metrics for analyzing the quality of services that provide functionality, the purpose of which is to identify potential problems before users start reporting them. The following functional requirements for the developed subsystem were formulated: - Implementation of the cloud system login
- Interface navigation, localization and selection of a virtual machine deployment service
- Creating and deleting a VM
- Checking the availability status of a virtual machine
- Calculation of key metrics of the service:
- Tracking login time
- Tracking the creation time of a virtual machine
- Tracking the running time of the entire script
When choosing key metrics, the need for further forecasting of service availability using mathematical models and event forecasting algorithms to achieve business targets was taken into account [4, 5, 6].
Non-functional requirements were also considered. The task of creating a virtual machine using the user interface is a process with a large number of steps, each of which must be considered from the point of view of potential errors and their appropriate handling, including ensuring reliable and stable behavior of the system in case the task unexpectedly fails with an error. Consequently, the following non-functional requirements were formulated:
- Start the script with the specified frequency and according to the schedule
- Automatic repetition of an unsuccessful operation during script execution. Provide for the configuration of the waiting interval between repetitions, and the number of repetitions
- Global time limit for the entire scenario. If the script does not fit within the allotted limit, it must be completed forcibly
To implement the test scenario, taking into account the formulated functional and non-functional requirements, the Python programming language and the selenium-python library [7] based on Selenium WebDriver were chosen. The Python language is very common [8] and allows you to implement applications of various levels of complexity in a short time. The simple and clear syntax, the absence of additional performance requirements, as well as the ease of debugging and testing makes it an ideal candidate for this study. Selenium WebDriver [9] together with the selenium-python library is widely used for testing web applications and allows you to emulate user interaction with the browser. 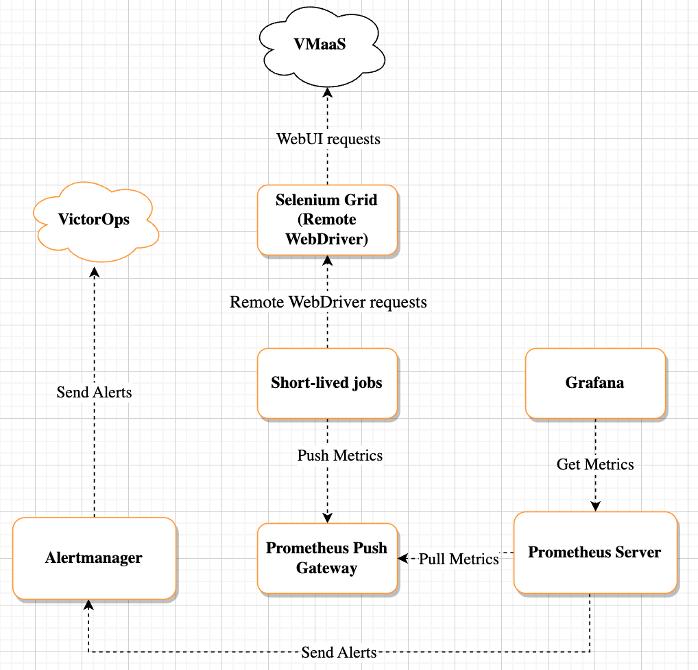
Figure 2. System architecture Based on the formulated functional and non-functional requirements, the corresponding architecture was developed (Fig. 2). Kubernetes, an open source software for automating the deployment, scaling and management of containerized applications, as well as a special type of Kubernetes resource – a periodic task (English Cronjob), was chosen as the platform for implementation. This type of resource allows you to schedule and launch tasks at a certain time, control the schedule and frequency, manage re-launches in case of errors, and also set a global limit on task completion. The Selenium Grid subsystem was used to interact with the user interface of the virtual machine deployment cloud service [10]. This component is a platform for remote script execution using WebDriver. It provides parallel launch of test scripts by executing them on different instances of remote browsers. VMaaS is a cloud service that provides a platform for deploying virtual machines. Prometheus was chosen as the main system for collecting and storing metrics, which is also responsible for processing metrics and generating notifications. Alertmanager – processes notifications generated by Prometheus and forwards them to VictorOps. This component is responsible for managing and handling incidents in real time and allows you to notify the appropriate teams in case of problems. Prometheus Pushgateway is an intermediate layer between short-lived tasks and the main Prometheus server. This component is necessary, since a feature of Prometheus' work is periodic polling of targets to collect metrics at a short interval - pull model, while tasks are run on their own schedule and for effective collection of metrics it is necessary to implement a push model. The task in progress sends an HTTP (English Hypertext transfer protocol) request to Prometheus Pushgateway, which temporarily stores metrics and is the target object for Prometheus. Grafana service was used together with Prometheus to create and configure graphs, charts and other visualization panels of metrics [11].
To assess the availability of the virtual machine deployment service, key metrics were selected. The user's login time was chosen for the main metric. This is the time during which the user is authenticated and authorized using the registered credentials. The measurement was carried out from the moment the credential entry form appeared, until the moment when the user was shown the main screen with the ability to start a virtual machine. To calculate time metrics, it was suggested to use the following time_monitor function. 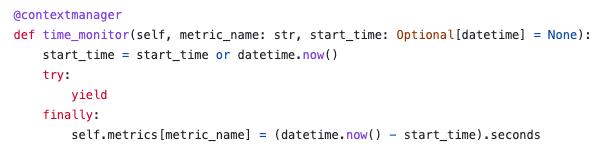
The use of this function for the login process is as follows: 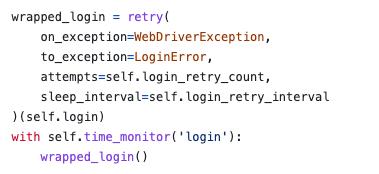
The next key metric was the launch time of the virtual machine (English launch instance). It determines the allowable limit during which we wait for the virtual machine to be ready. 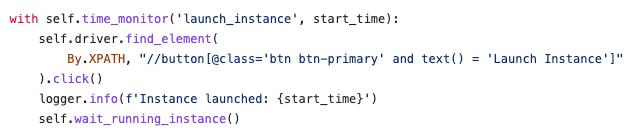
If this limit is exceeded, the script will fail with an error. 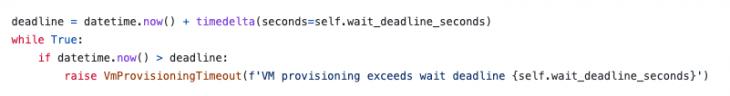
The last key metric was the total running time of the virtual machine creation script, which includes processing expected exceptional situations, repeating operations, waiting for the machine to be ready and then deleting it. The removal of the machine is an integral part of the completion of the test scenario, since all resources allocated during operation must be released.
The virtual machine startup time metric was analyzed and a threshold value was determined, which was used in Prometheus to create notifications.
To choose the optimal method for determining the threshold value, it is necessary to check whether the distribution is normal. To do this, it was proposed to apply the Shapiro-Wilk test [12]. The verification is based on the verification of the null hypothesis – the data is distributed normally. An alternative hypothesis is that the data does not have a normal distribution. The result of the Shapiro-Wilk criterion is the value of statistics, as well as the value of p-value. In most cases, 0.05 is taken as the threshold value. If the p-value is less than 0.05, the null hypothesis is rejected. The python SciPy library was used for implementation. An array of metrics of the VM startup time from Prometheus for the last 7 days was used as input data. 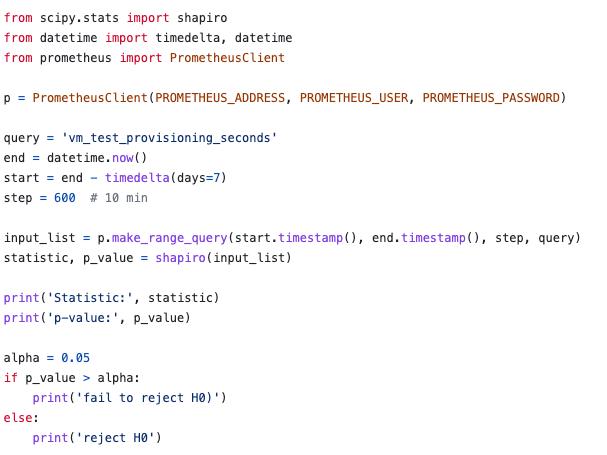
As a result, a low p-value of 2.098965063816978e-31 was obtained, on the basis of which the null hypothesis was rejected and it was concluded that the data do not have a normal distribution. To calculate the threshold value, the following method was used – the sum of the median and three absolute deviations [13] Threshold = Median + 3 * MAD Using the Python Numpy library, the median of the data was calculated and the average absolute deviation was calculated. 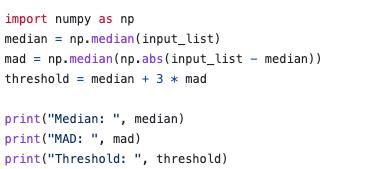
As a result, a median of 131.5, an average absolute deviation of 12.5 and a threshold value of 169 were calculated. Results and discussion. A system has been developed that allows you to collect various key parameters of the virtual machine deployment cloud service, based on a real scenario simulating the user's work. 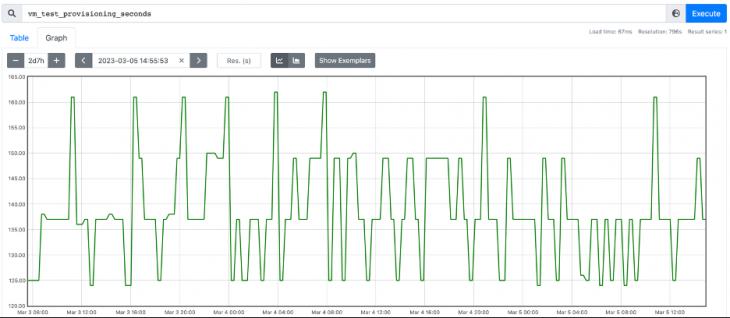
Figure 3. Virtual machine startup time After analyzing the collected data (Fig. 3) by summing the median and three absolute deviations, a threshold value of 169 was calculated, which can be used in Prometheus in an expression describing a potential problem in the virtual machine deployment service. Exceeding this threshold signals a significant deviation from the expected values, and requires immediate escalation and technical investigation of the causes by the profile support team of the service [14]. Conclusions The main result of the work is the developed system for testing the availability of virtual machines and the method of integration into the monitoring system of Intel's internal cloud service. The main test case was proposed and implemented - the creation and removal of a virtual machine using a graphical user interface, the criteria for triggering triggers were determined. During the operation of cloud environments with the help of this system, problem areas were identified in the architecture of the virtual machine creation service, which made it possible to optimize the system operation in a timely manner. By analyzing the collected data, problems with the performance of the web interface were identified and eliminated, which significantly improved the user experience in using this interface. The developed system allows you to register deviations in the behavior of the service by a number of key parameters, such as the login time and the startup time of the virtual machine. Thanks to this, it was possible to significantly reduce the response time to emerging incidents. The use of free and open source technologies, such as Prometheus, Selenium, contributes to increasing the efficiency and reducing the company's costs for maintaining cloud services. The described method is an effective way to test cloud services, and can also be used to analyze and improve reliability and availability – the most important criteria for business applications running 24/7
References
1. Prometheus – Monitoring system & time series database. Retrieved from https://prometheus.io/docs/introduction/overview/
2. Official intel web site. Retrieved from https://www.intel.com/
3. The selenium browser automation project. Retrieved from https://www.selenium.dev/documentation/
4. Shchemelinin D. (2021). Mathematical Models and Methods for Monitoring and Predicting the State of Globally Distributed Computing Systems. Proc. of Telecom. Universities, 7(3), 73‒78.
5. Shchemelinin D. (2021). A method for predicting events in globally distributed computing complexes. Modern Science: Current Issues in Theory and Practice. Series: Natural Technical Sciences, 12–2, 47–54.
6. Shchemelinin D. (2021). Method and algorithm for automatic recovery of information services based on objective predictive monitoring data. Modern Science: Current Issues in Theory and Practice. Series: Natural Technical Sciences, 8, 140–144.
7. Selenium with python. Retrieved from https://selenium-python.readthedocs.io/
8. The TIOBE Programming Community index an indicator of the popularity of programming languages. Retrieved from https://www.tiobe.com/tiobe-index/
9. Sujay Raghavendra. (2020). – Python testing with selenium – Apress Berkeley CA.
10. When to use selenium grid. Retrieved from https://www.selenium.dev/documentation/grid/applicability/
11. Grafana documentation. Retrieved from https://grafana.com/docs/grafana/latest/
12. Power comparisons of Shapiro-Wilk, Kolmogorov-Smirnov, Lilliefors and Anderson-Darling tests. (2011). Journal of Statistical Modeling and Analytics, 1, 21-33. (Vol. 1). Retrieved from https://www.nrc.gov/docs/ML1714/ML17143A100.pdf
13. Detecting outliers: Do not use standard deviation around the mean, use absolute deviation around the median. Journal of Experimental Social Psychology, 49(4), 764–766. Retrieved from https://www.sciencedirect.com/science/article/pii/S0022103113000668
14. Shchemelinin D. (2021). System of criteria and algorithm of information processing and decision-making for the software module for displaying the most significant monitoring events in the information system. XXI century: results of the past and current issues plus, 3(55), 67–71. (Vol. 10).
Peer Review
Peer reviewers' evaluations remain confidential and are not disclosed to the public. Only external reviews, authorized for publication by the article's author(s), are made public. Typically, these final reviews are conducted after the manuscript's revision. Adhering to our double-blind review policy, the reviewer's identity is kept confidential.
The list of publisher reviewers can be found here.
The subject of the study. Taking into account the specified title of the scientific article, it should be devoted to the development of an automated testing system for a cloud service for deploying virtual machines using modern monitoring tools. The content of the article corresponds to the stated topic. The research methodology is based on the development of a virtual machine availability testing system and a method of integration into the monitoring system of Intel's internal cloud service. Moreover, the study was conducted using Python, which creates a positive impression of the quality of the chosen methodology. It is very valuable that, according to the text of the article, the author actively uses a graphical method of presenting the results of scientific research, while finalizing the article, it is necessary to sign the names of all drawings (including those related to the code) and indicate the data source (if developed by the author, then it should be indicated). The relevance of the study of issues related to the practical use of information technologies and achievements of scientific and technological progress is beyond doubt, because this allows us to provide scientific justification for measures to ensure the technological sovereignty of the Russian Federation, the need for which was stated by the President of Russia. The scientific novelty in the materials submitted for review is contained and extremely clearly defined: it is related to the developed system for testing the availability of virtual machines and the method of integration into the monitoring system of Intel's internal cloud service. Style, structure, content. The style of scientific presentation. The article has a fairly well-structured structure, which creates a positive impression of familiarization with it. It is recommended to add the block "Suggestions for the practical use of the author's development". Filling the content of this structural element will ensure the growth of interest in this scientific publication exponentially. It is valuable that the article is based on the specific results obtained by the author. Bibliography. The author has compiled a bibliographic list of 14 sources. However, scientific publications of 2022-2023, including in foreign publications, have not been studied. This would make it possible to take into account the latest trends in the scientific literature on the issues under consideration. Appeal to opponents. Despite the formed list of references and, in general, the high quality of the scientific article, including those related to the presence of specific author's judgments and developments, their discussion with the results of research reflected in the works of other authors has not been carried out. When finalizing the article, it is necessary to pay important attention to this, because this will further improve the quality of the scientific article submitted for review, including creating prerequisites for expanding the readership. Conclusions, the interest of the readership. Taking into account all of the above, it should be noted that the article is made on an urgent topic at a fairly high level, has a high level of potential interest from the readership (both in the scientific community and from the public authorities of the Russian Federation, subjects of the Russian Federation, business entities). After making the adjustments indicated in the text of the review (which are mainly formal in nature, but compliance with the rules of registration of a scientific article is as important as its content), it can be approved for publication.
|


